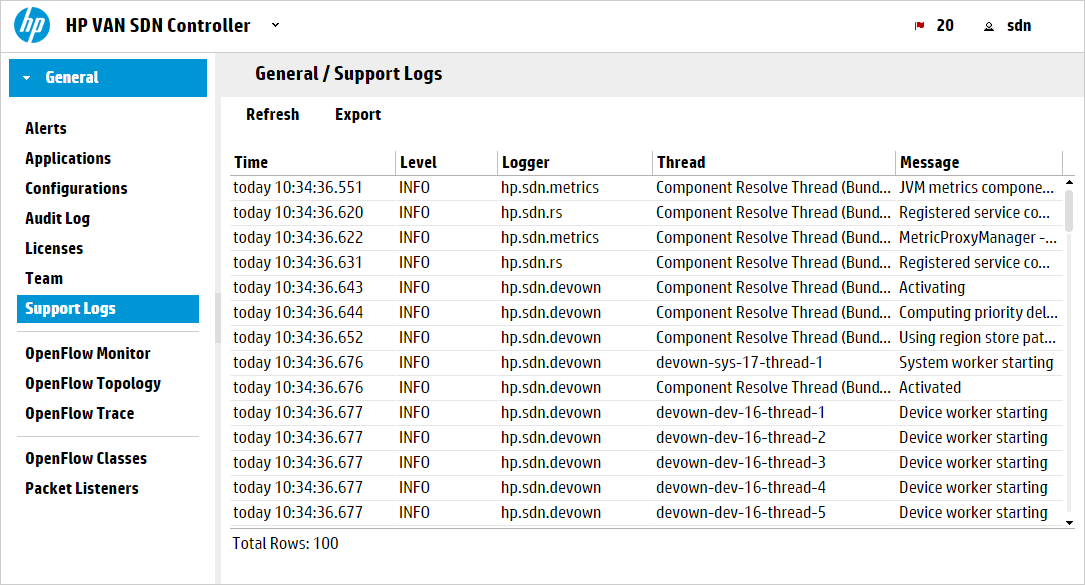
The support logs maintain an internal record of events of interest from the operations of an active SDN controller. This information is the type of data a support engineer would request when troubleshooting an SDN installation.
The log file is configured to have a maximum size of 10 MB and to keep 4 previous versions. With 4 full previous versions and the one active log, the core controller logging will consume at most 50 MB of disk space. The controller allows up to five support logs; one active and four in storage:
-
When the current log reaches 10 MB, the controller copies the log to storage and starts a new log.
-
When the log file has rolled over four times, the controller purges the oldest log file when it needs to roll over again. The core controller has at most 5 log files.
-
Support logs are stored in the controller
/var/log/sdn/virgo/logsdirectory.
In a controller team environment:
-
Each controller maintains its own support logs.
-
Changing the support log queue size on any controller propagates to all active controllers in the team.
-
The Export action gathers the set of support log file data from all active controllers in the team, and stores the data as a single compressed archive.
| Screen component | Description | ||||||||||||
|---|---|---|---|---|---|---|---|---|---|---|---|---|---|
| Refresh |
Displays a listing of the most recent log messages, as determined by the currently configured queue size. For example, with a queue size of 100, Refresh lists the 100 most recent log messages. |
||||||||||||
| Export |
Gathers the set of support log file data from the standalone controller or all active controllers in the team, and stores the data as a single compressed archive. |
||||||||||||
| Level |
The severity level for the entry. The logging levels are hierarchical. Messages are logged with the lowest logging level and above. The lowest level is TRACE, which results in all messages being logged for the selected logger when the TRACE logging level is specified. INFO is the logging level In the default configuration. Severity levels are:
Using the Virgo Administrator console, you can dynamically change the logging level for a component that is writing to the support log. For example, you can enable the DEBUG level logging for just the You can also dynamically change the logging level by using the REST API. See HPE VAN SDN Controller REST API Reference |
||||||||||||
| Logger |
The module or feature that triggered the logging condition. |
||||||||||||
| Thread |
The thread that caused the logging condition to occur. |
||||||||||||
| Message |
Describes the details of the logging condition. |
||||||||||||
| Data |
Detailed information about the log entry. |
||||||||||||
| Controller ID |
A hexadecimal number that identifies controller that generated the log entry. When you use controller teaming, this ID enables you to identify which controller in the team generated the alert. |
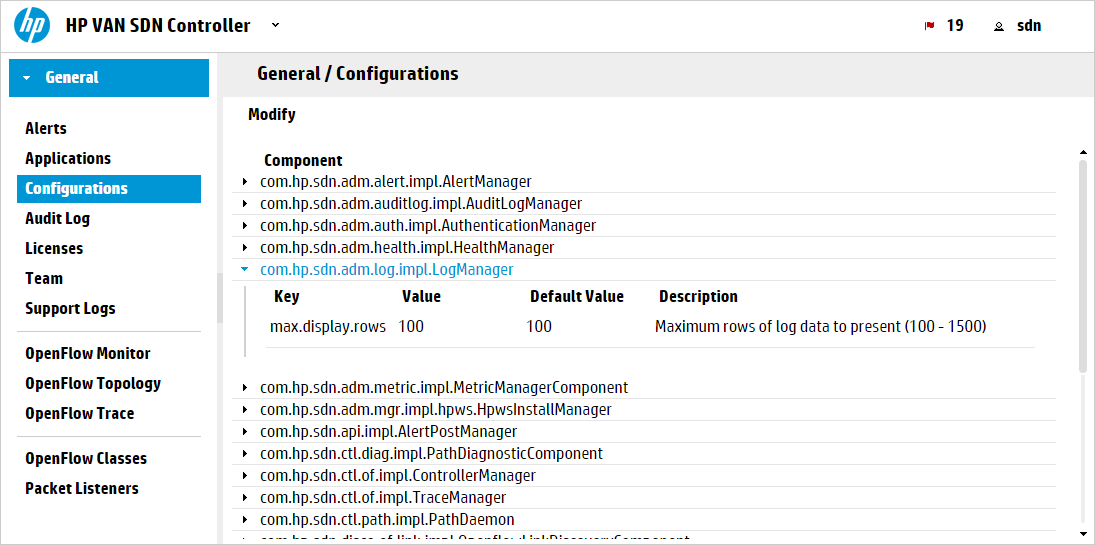
The default queue size is 100 lines. To configure a different queue size, change the value for the max.display.rows key of the com.hp.sdn.adm.log.impl.LogManager component.
-
Gathers the set of support log file data from the controller, or in a team environment, all active controllers in the team, and stores the data as a single compressed archive file:
-
Downloads the archive file from the controller to the default download directory specified by your browser. For example, in Ubuntu installations, this is usually the
Downloadsdirectory. -
The following menu appears in the lower-left corner of the controller console:
-
When the download completes, you can either resume interaction with the controller or examine the log by selecting an item from the menu, such as:
![[NOTE: ]](images/note.gif)
NOTE: The actions resulting from these choices depend on the browser and operating system, not on the controller.