This troubleshooting tool logs OpenFlow conversations captured in messages to and from the controller and the OpenFlow devices it manages.
You can export the captured messages in the trace log to a CSV (Comma-Separated Values) file that can be opened by applications such as Excel that are designed to accommodate this file type. This enables you to create a filter to display only the messages from the specific data paths you want to examine.
The number of events that can be held in the trace log is limited by system memory. For this reason, HP recommends that you export to a remote storage location any trace log content you want to retain, and to clear the controller trace log whenever its content is not needed on the controller itself.
| Screen component | Description |
|---|---|
Starts trace logging. In the default configuration, the trace stops after ten seconds have passed. (To change the trace interval, see “Changing the OpenFlow trace interval ”.) | |
Stops trace logging before the end of the configured trace interval. Trace logging stops automatically at the end of the configured trace interval. Multiple consecutive traces can be held in the trace log. To add additional trace results, start another trace. | |
Clears (resets) the current trace log. To preserve the contents of the trace log before clearing it, see “Exporting the OpenFlow trace log”. | |
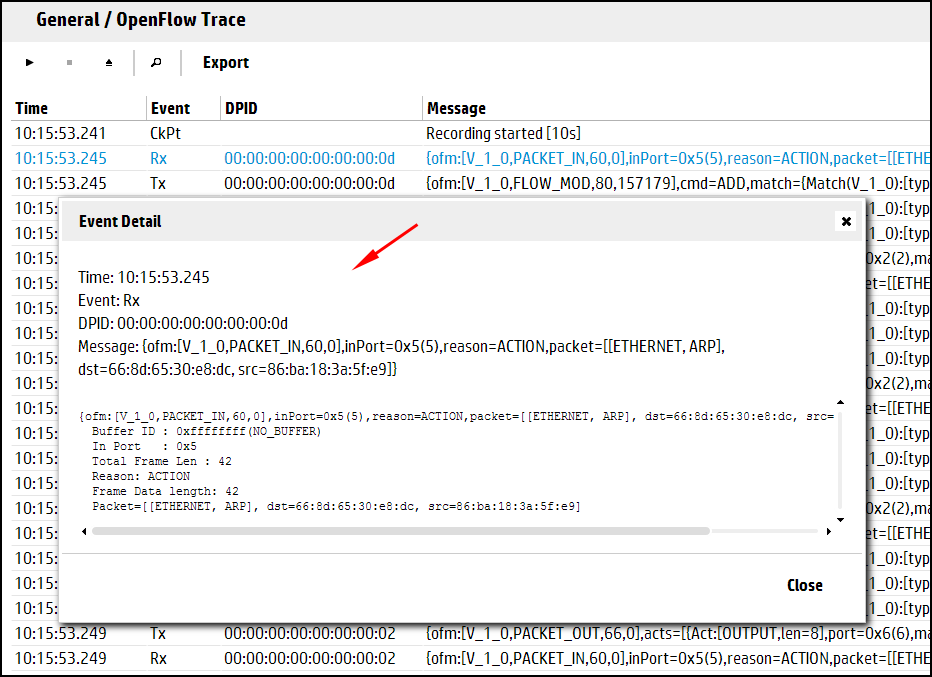
Displays details of the selected trace event. | |
| Export | Copies the trace log into a CSV (comma-separated values) file. See see “Exporting the OpenFlow trace log”. |
| Time | The time the message event was generated. |
| Event | The event type. For example:
|
| DPID | The DPID (data path ID) of the data path associated with the event. |
| Message | The trace message. |
Use the buttons above the Time field to control trace operations (see “OpenFlow trace display details”).
Exporting an OpenFlow Trace Log places the trace content in a CSV file that is stored in the default downloads folder specified in your web browser settings.
For more information about CSV files, see RFC 4180.
NOTE: This section shows how to export and access OpenFlow Trace Log files using Google Chrome. You might experience different results than shown here, depending on your web browser and its configuration. | |
Click . This action places the trace log contents into a CSV file in the default downloads folder in the system on which the controller is running. Check your web browser for an indication that the file has been created.
To display and filter the CSV file content, see “Filtering the OpenFlow trace log in a CSV file”.
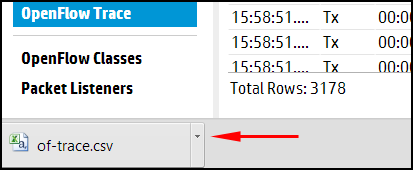
Open the CSV file in the default folder. For example, using Google Chrome, open the menu adjacent to the file name (
of-trace.csv) and select .In the resulting folder listing, locate the
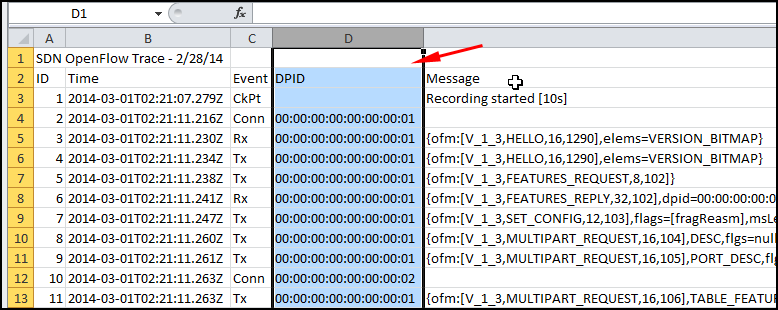
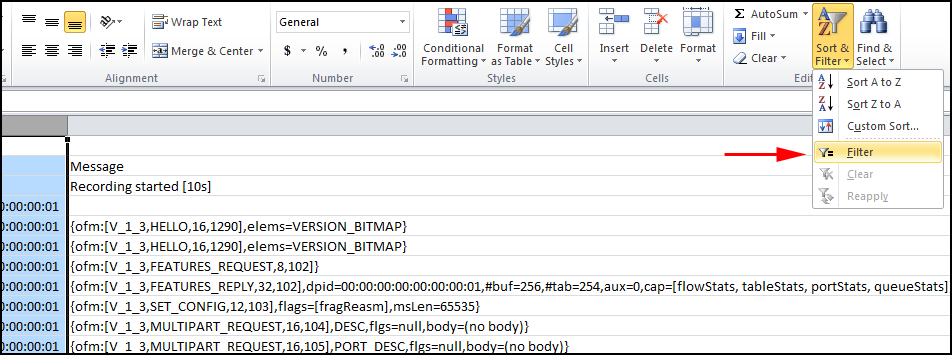
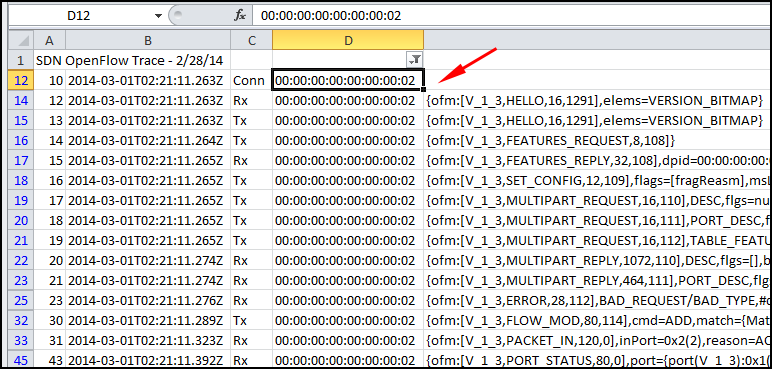
of-trace.csvfile and open it using an application, such as Excel, that enables you to read the log messages and configure a filter. For example, to investigate the messages collected for data path 00.00.00.00.00.00.00.02:Select the DPID (Data Path ID) column.
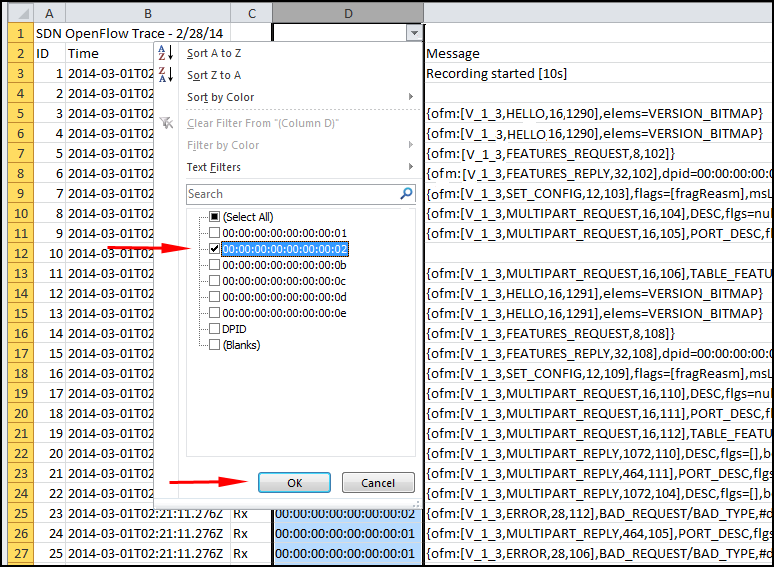
Apply the filter by checking the box for data path 00.00.00.00.00.00.00.02.
In the resulting display, only the data filtered to data path 00:00:00:00:00:00:00:02 appears.