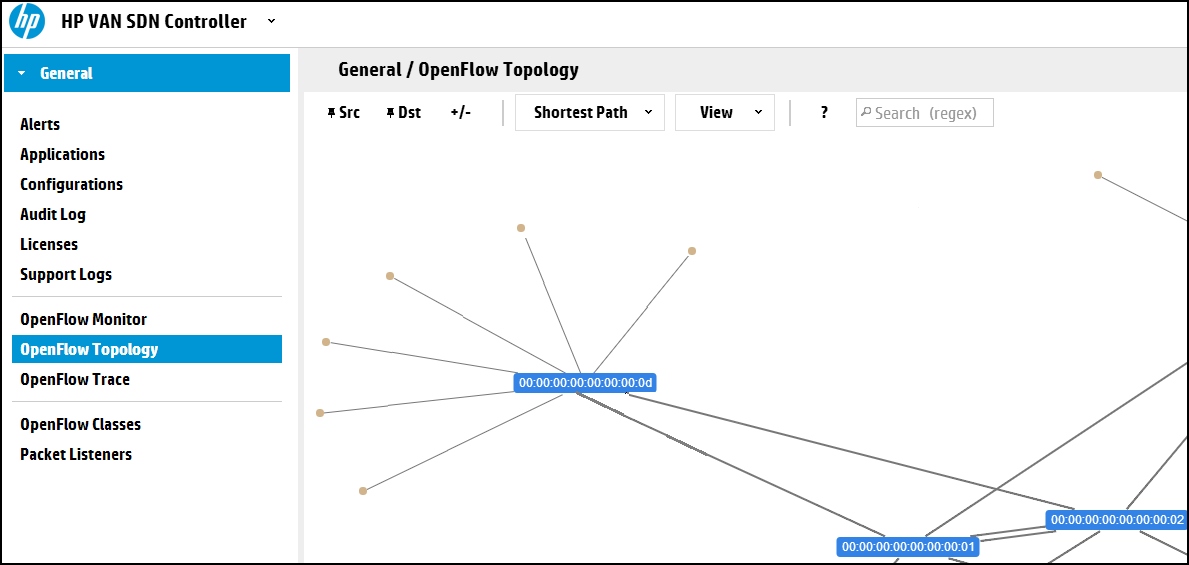
The OpenFlow screen displays a topology of discovered switches and end nodes in the controller domain. The viewer creates and updates a graph of the network, and computes the broadcast tree to avoid loops and broadcast storms. The shortest path is computed using Dijkstra’s graph search algorithm. The viewer:
NOTE: In a topology where two or more controlled switches connect to the same uncontrolled switch, the controller will not learn the location of hosts directly connected to the uncontrolled switch. | |
CAUTION: Do not allow a loop between the OpenFlow and non-OpenFlow portions of your network unless you enable Spanning Tree Protocol on the non OpenFlow devices operating in the network. | |
The OpenFlow Topology screen includes the switches and end-nodes in the controller domain.

Both of the following tools provide control for different parts of the OpenFlow Topology display:
The
 icon for a list of keyboard shortcuts you can use to change the display.
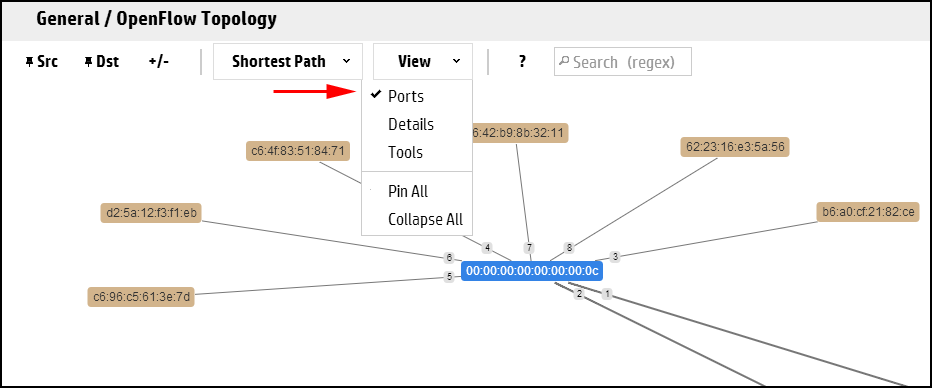
The View menu for:
Port labels on switches
Switch datapath details
A tool for selecting Packet selection criteria
End nodes can be labelled with one of the following:
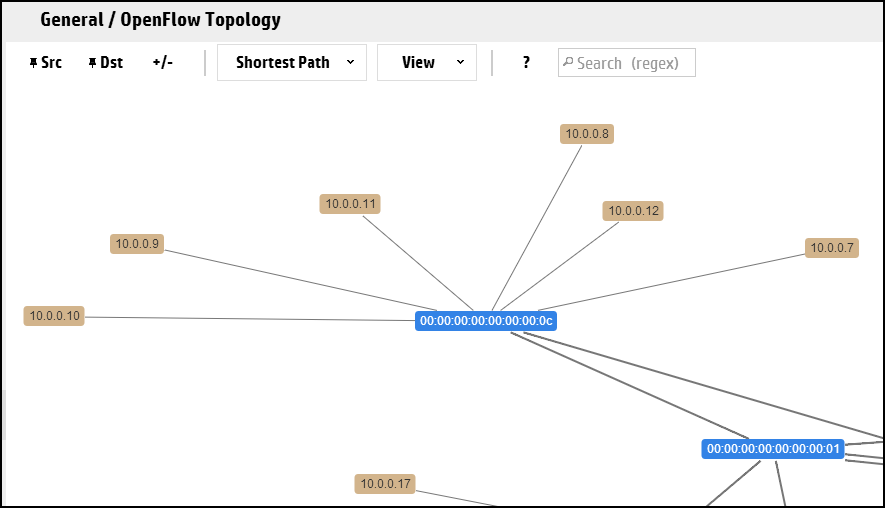
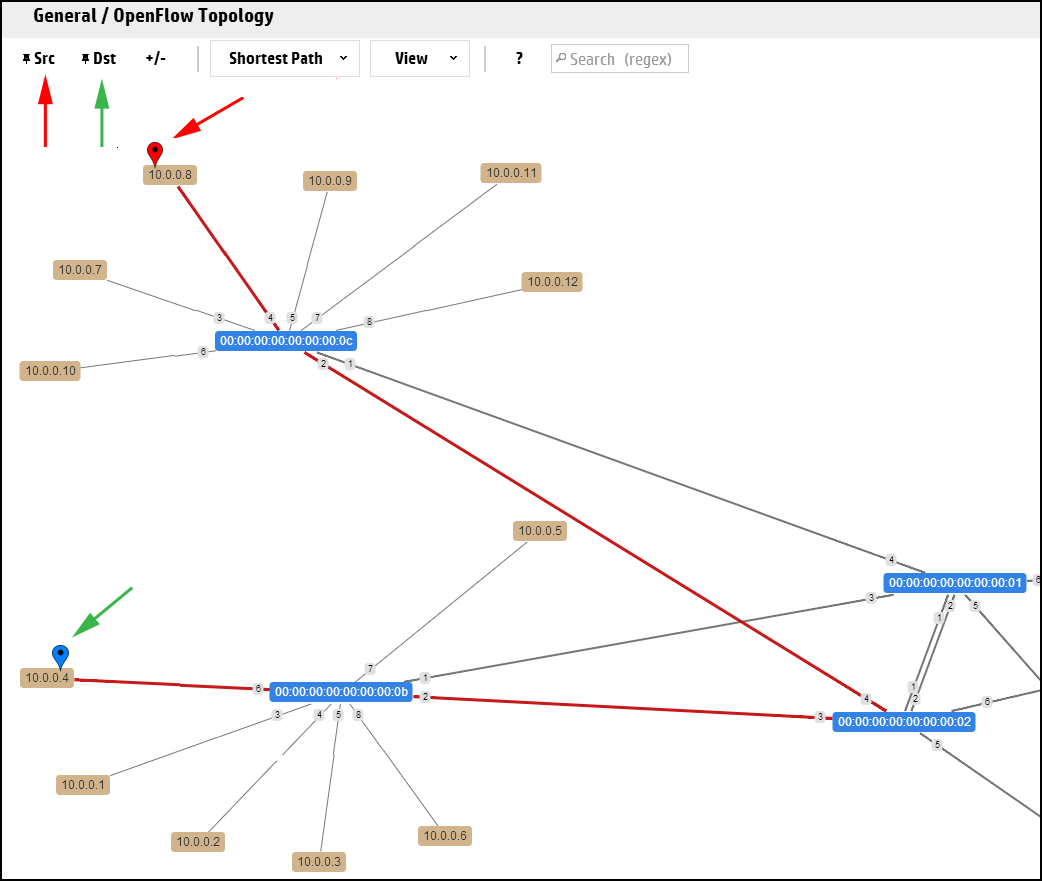
For example, to show the IP addresses of the end-nodes in the OpenFlow topology, click anywhere in the topology display, then press N. The end-node IP addresses appear as labels in the topology diagram:
Press N again to display the end-node MAC addresses as labels in the topology diagram:
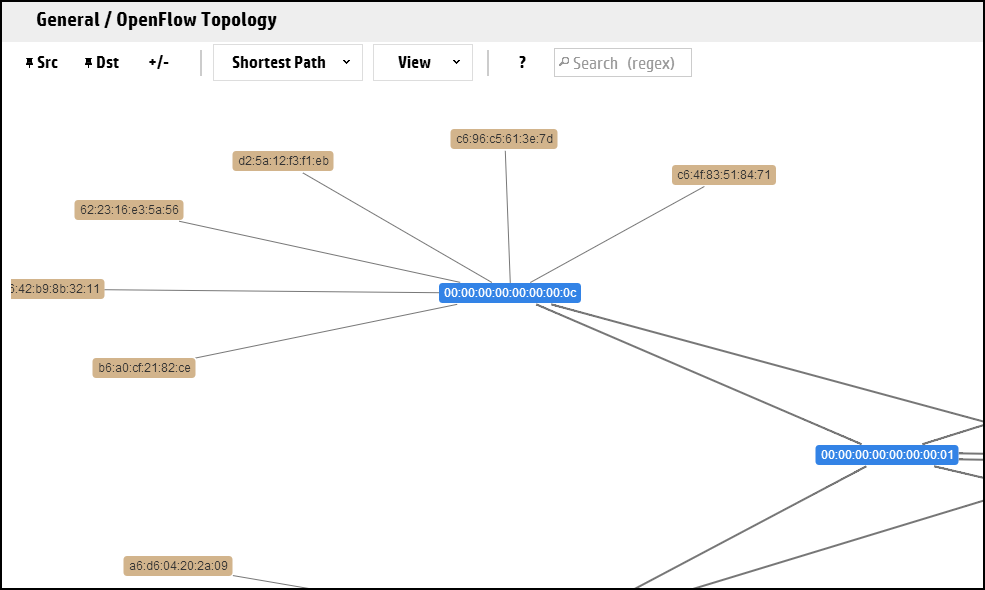
Press N again to return to the unlabeled end-node view.
Switches are always labelled with their data path ID. You can also:
Add port labels to the links between switches and between switches and end nodes.
Identify flow details and options. (See “Identifying flow details and flow options”.)
"Collapse" the topology display to show only the number of end nodes connected to each switch, instead of showing all end nodes (the default) which can present a cluttered display where a large number of end nodes are connected to the OpenFlow switches.
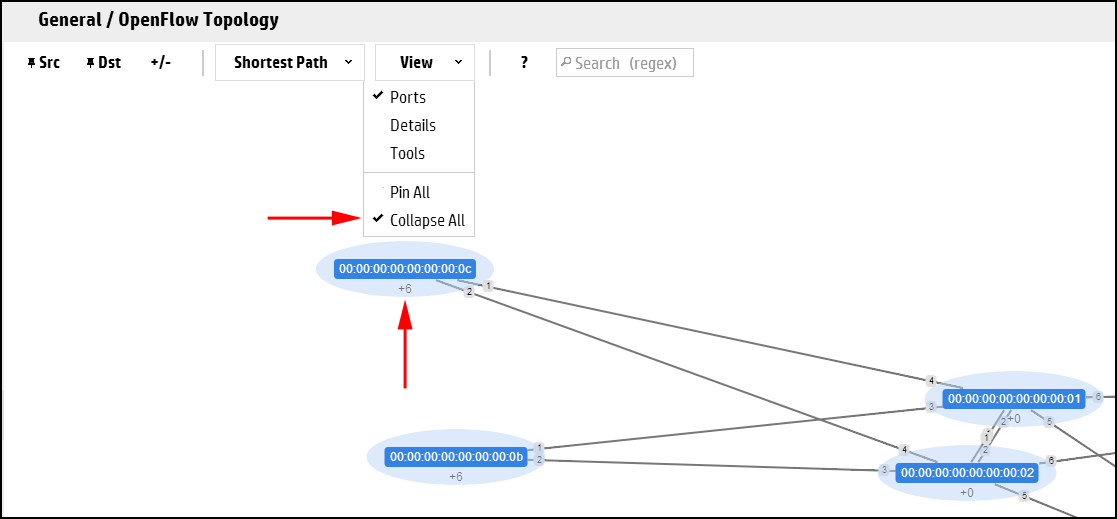
The number appearing under the Data Path ID for a switch in the topology diagram indicates the number of detected end nodes connected to the switch.
To toggle between hiding or showing all switch end nodes, click anywhere in the topology display and then press G.
To toggle between hiding or showing the end nodes for a particular switch, select the switch and then press C.
NOTE: Shortest path highlighting when Src and Dst are selected as switches is not supported. Please select hosts as Src and Dst for viewing the shortest path. | |
The controller displays the path between the two nodes as a red line (see Figure 17).
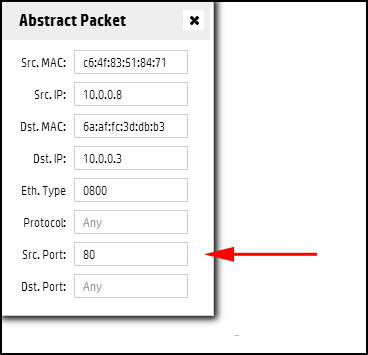
The Switch Details window displays the flow details and the Abstract Packet window displays selection criteria for packets moving between the Source-Destination node pair.
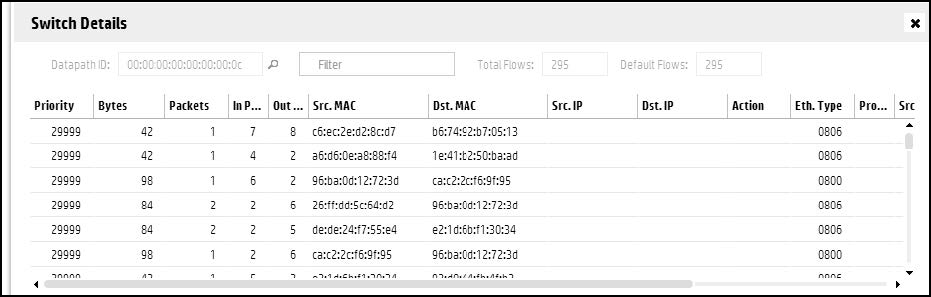
Using the fields in the Abstract Packet window, search for flow rules for packets having criteria dictating a path other than shortest path, for example, by entering port 80 for HTTP packets.