When the controller is active in an OpenFlow domain, the OpenFlow Monitor enables tracking of switch traffic summaries, packet traffic per port, and applied flow rules for switches detected in the controller domain. The main display lists the Data Path IDs and descriptive information for the active switches and the options for viewing traffic information.
| Screen component | Description |
|---|---|
Updates the information displayed on the screen. | |
Displays the “Summary for data path view” for the selected data path. | |
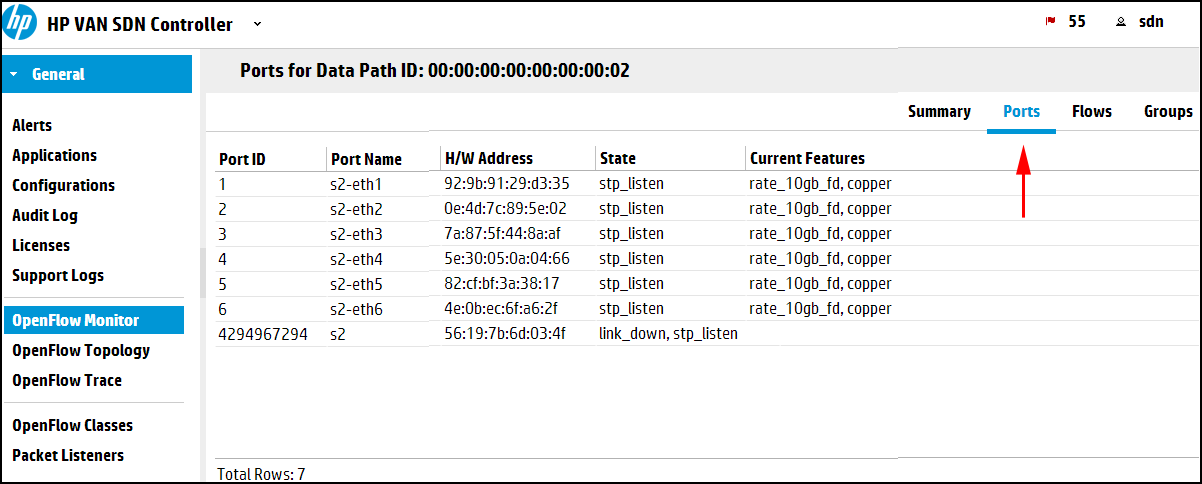
Displays the “Ports for data path display” for the selected data path. | |
Displays the “Flows for data path display” for the selected data path. | |
Displays the Groups view for the selected data path. | |
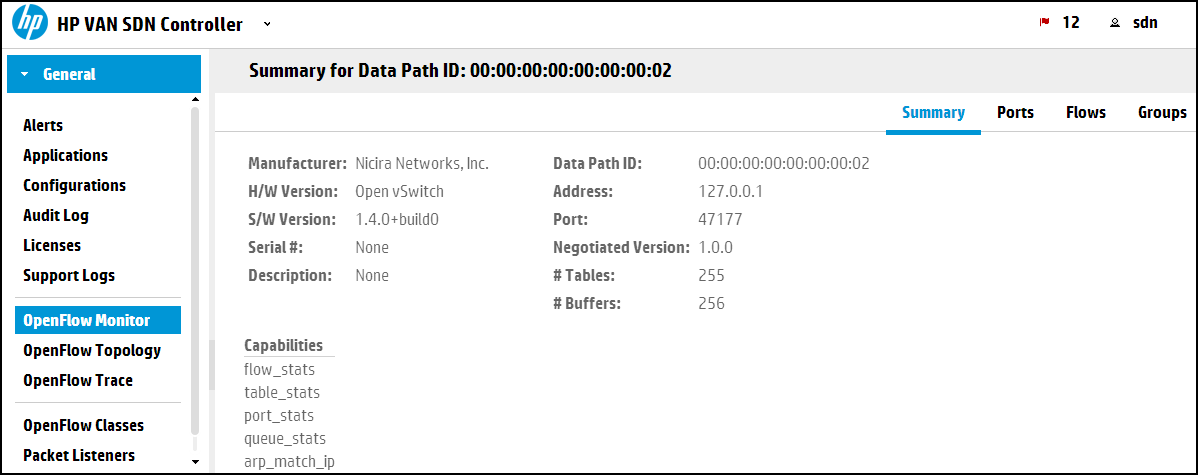
Identifies a detected OpenFlow switch. The OpenFlow data path identification for each detected OpenFlow switch. This ID also appears in the representation of the switch in the OpenFlow Topology screen. | |
Identifies the IP address associated with an OpenFlow data path instance. | |
The version of OpenFlow in use with the corresponding data path. |
This view includes the following related to the selected device:
This view includes the current flows on the selected OpenFlow device. For a given flow, traffic meeting the requirements specified in the "Matches" field is directed as specified in the corresponding "Actions/Instructions" field.
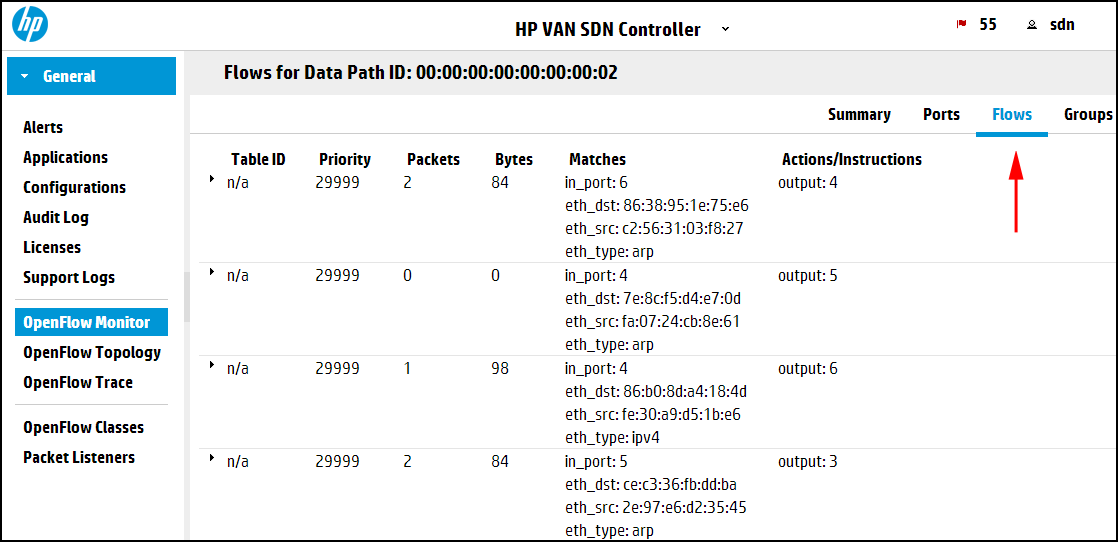
NOTE: The Table ID applies to OpenFlow 1.3 and greater, but not to OpenFlow 1.0. | |
Click to update the display for Topology changes, such as a newly discovered OpenFlow device or the loss of a device that has been disconnected.
To view information about a specific device, click the Data Path ID for that device and then click the button for the view you want to display.
For a graphical view of Data Path ID assignments to individual OpenFlow switches, see OpenFlow topology screen.