The instrumentation monitor can be used to detect anomalies caused by security attacks or other irregular operations on the switch. The following table shows the operating parameters that can be monitored at pre-determined intervals, and the possible security attacks that may trigger an alert:
Parameters for monitoring
| Parameter name | Description |
|---|---|
| pkts-to-closed-ports | The count of packets per minute sent to closed TCP/UDP ports. An excessive amount of packets could indicate a port scan, in which an attacker is attempting to expose a vulnerability in the switch. |
| arp-requests | The count of ARP requests processed per minute. A large amount of ARP request packets could indicate an host infected with a virus that is trying to spread itself. |
| ip-address-count | The number of destination IP addresses learned in the IP forwarding table. Some attacks fill the IP forwarding table causing legitimate traffic to be dropped. |
| system-resource-usage | The percentage of system resources in use. Some Denial-of- Service (DoS) attacks will cause excessive system resource usage, resulting in insufficient resources for legitimate traffic.
|
| login-failures/min | The count of failed CLI login attempts or SNMP management authentication failures. This indicates an attempt has been made to manage the switch with an invalid login or password. Also, it might indicate a network management station has not been configured with the correct SNMP authentication parameters for the switch. |
| port-auth-failures/min | The count of times a client has been unsuccessful logging into the network. |
| system-delay | The response time, in seconds, of the CPU to new network events such as BPDU packets or packets for other network protocols. Some DoS attacks can cause the CPU to take too long to respond to new network events, which can lead to a breakdown of Spanning Tree or other features. A delay of several seconds indicates a problem. |
| mac-address-count | The number of MAC addresses learned in the forwarding table. Some attacks fill the forwarding table so that new conversations are flooded to all parts of the network. |
| mac-moves/min | The average number of MAC address moves from one port to another per minute. This usually indicates a network loop, but can also be caused by DoS attacks. |
| learn-discards/min | Number of MAC address learn events per minute discarded to help free CPU resources when busy. |
-
To generate alerts for monitored events, you must enable the instrumentation monitoring log and/or SNMP trap. The threshold for each monitored parameter can be adjusted to minimize false alarms (see Configuring instrumentation monitor.
-
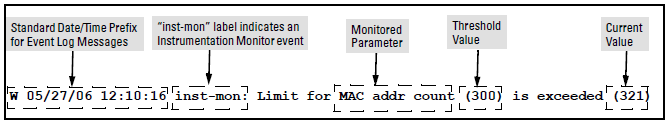
When a parameter exceeds its threshold, an alert (event log message and/or SNMP trap) is generated to inform network administrators of this condition. The following example shows an event log message that occurs when the number of MAC addresses learned in the forwarding table exceeds the configured threshold:
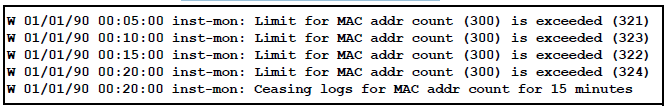
In the preceding example, if a condition is reported 4 times (persists for more than 15 minutes) then alerts cease for 15 minutes. If after 15 minutes the condition still exists, the alerts cease for 30 minutes, then for 1 hour, 2 hours, 4 hours, 8 hours, and after that the persisting condition is reported once a day. As with other event log entries, these alerts can be sent to a server.
-
Known Limitations: The instrumentation monitor runs once every five minutes. The current implementation does not track information such as the port, MAC, and IP address from which an attack is received.
The following commands and parameters are used to configure the operational thresholds that are monitored on the switch. By default, the instrumentation monitor is disabled.
Syntax:
To enable instrumentation monitor using the default parameters and thresholds, enter the general instrumentation monitor command. To adjust specific settings, enter the name of the parameter that you wish to modify, and revise the threshold limits as needed.
Example:s:
The show instrumentation monitor configuration command displays the configured thresholds for monitored parameters.
Viewing the instrumentation monitor configuration
HP Switch# show instrumentation monitor configuration

 PARAMETER                 LIMIT
 ------------------------- ---------------
 mac-address-count         1000 (med)
 ip-address-count          1000 (med)
 system-resource-usage     50 (med)
 system-delay              5 (high)
 mac-moves/min             100 (med)
 learn-discards/min        100 (med)
 ip-port-scans/min         10 (med)
 arp-requests/min          100 (low)
 login-failures/min        10 (med)
 port-auth-failures/min    10 (med)

SNMP trap generation for alerts: enabled
Instrumentation monitoring log : enabled
An alternate method of determining the current Instrumentation Monitor configuration is to use the show run command. However, the show run command output does not display the threshold values for each limit set.