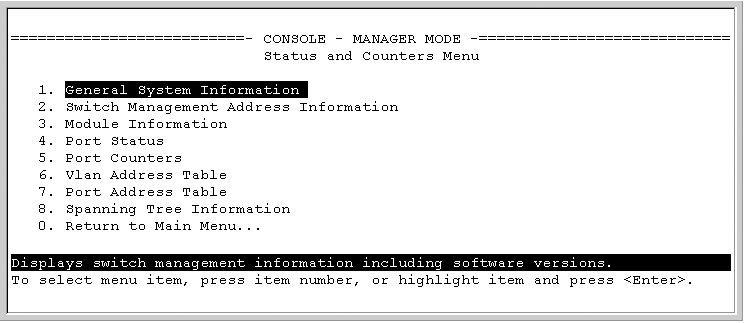
This section describes the status and counters screens available through the switch console interface and/or the WebAgent.
|
|
|
![[NOTE: ]](images/note.gif) |
NOTE: You can access all console screens from the WebAgent via Telnet to the console. Telnet access to the switch is available in the Device View window under the Configuration tab. |
|
|
Beginning at the Main Menu, display the Status and Counters menu by selecting:
Each of the above menu items accesses the read-only screens described on the following pages. See the online help for a description of the entries displayed in these screens.
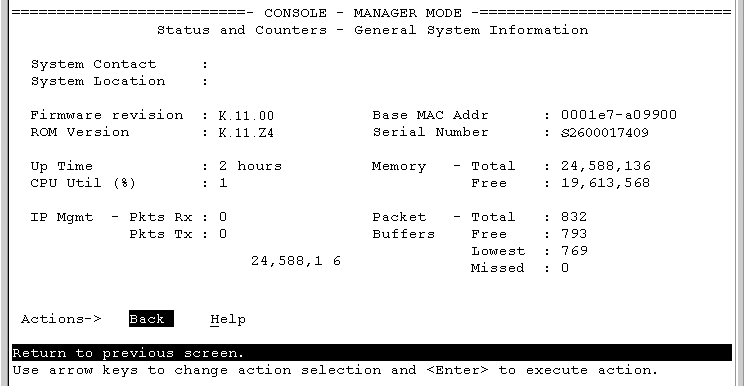
From the console Main Menu, select:
This screen dynamically indicates how individual switch resources are being used. See the online Help for details.
Syntax:
Displays global system information and operational parameters for the switch.
chassislocateShows the chassisLocator LED status. Possible values are On, Off, or Blink.
When the status is On or Blink, the number of minutes that the Locator LED will continue to be on or to blink is displayed. (See Command results for show system chassislocate command)
informationShows global system information and operational parameters for the switch. (See Switch system information.)
power-supplyShows chassis power supply and settings.
temperatureShows system temperature and settings.
fansShows system fan status. (See System fan status.)
Command results for show system chassislocate command
HP Switch(config)# show system chassislocate

Chassis Locator LED: ON 5 minutes 5 seconds

HP Switch(config)# show system chassislocate

Chassis Locator LED: BLINK 10 minutes 6 seconds

HP Switch(config)# show system chassislocate

Chassis Locator LED: OFF
System fan status
HP Switch(config)# show system fans

Fan Information
   Num | State | Failures
-------+-------------+----------
 Sys-1 | Fan OK | 0

0 / 1 Fans in Failure State
0 / 1 Fans have been in Failure State
Switch system information
HP Switch(config)# show system

 Status and Counters - General System Information

  System Name        : HP Switch
  System Contact     :
  System Location    :

  MAC Age Time (sec) : 300

  Time Zone          : 0
  Daylight Time Rule : None

  Software revision  : T.13.XX     Base MAC Addr   : 001635-b57cc0
  ROM Version        : XX.12.12     Serial Number   : LP621KI005

  Up Time            : 51 secs     Memory - Total  : 152,455,616
  CPU Util (%)       : 3                    Free   : 100,527,264

  IP Mgmt - Pkts Rx  :0            Packet - Total  : 6750
            Pkts Tx  :0            Buffers  Free   : 5086
                                            Lowest : 5086
                                            Missed : 0
The task monitor feature allows you to enable or disable the collection of processor utilization data. The task-monitor cpu command is equivalent to the existing debug mode command taskusage -d. (The taskUsageShow command is also available.)
When the task-monitor command is enabled, the show cpu command summarizes the processor usage by protocol and system functions.
Syntax:
The task usage reporting feature provides the ability to collect and display CPU usage data (with a refresh rate of 5 seconds) of running tasks on the switch. It includes the following commands:
Syntax:
Syntax:
show cpu [<CHASSIS_MIN_CPU_UTIL_INDEX-CHASSIS_MAX_CPU_UTIL_INDEX>]
[<CHASSIS_MIN_CPU_UTIL_INDEX-CHASSIS_MODULE_MAX_CPU_UTIL_INDEX>]]
Syntax:
Output for the show cpu process command
HP Switch# show cpu process

                              | Recent |  %   | Time Since | Times  | Max
Process Name      | Priority  | Time   | CPU  | Last Ran   | Ran    | Time
----------------- + --------- + ------ + ---- + ---------- + ------ + -------
Idle-1            | 226       | 10 s   | 41   | 57 us      | 380986 | 69 us
Idle-3            | 1         | 5 s    | 20   | 52 us      | 761665 | 55 us
Idle-0            | 226       | 8 s    | 33   | 19 us      | 380867 | 66 us
Sessions & I/O-24 | 171       | 926 ms | 3    | 1 ms       | 150    | 335 ms
Output for the show cpu process slot <slot-list> command
HP Switch# show cpu process slot A
slot a:

                              | Recent |  %   | Time Since | Times  | Max
Process Name      | Priority  | Time   | CPU  | Last Ran   | Ran    | Time
----------------- + --------- + ------ + ---- + ---------- + ------ + -------
System Services-2 | 156       | 253 ms | 2    | 767 ms     | 12     | 35 ms
Idle-3            | 1         | 3 s    | 28   | 13 ms      | 101309 | 150 us
Hardware Mgmt-2   | 192       | 282 ms | 2    | 303 us     | 44     | 12 ms
Idle-1            | 226       | 6 s    | 55   | 13 ms      | 50793  | 233 us
Idle-0            | 226       | 1 s    | 9    | 14 ms      | 50633  | 106 us
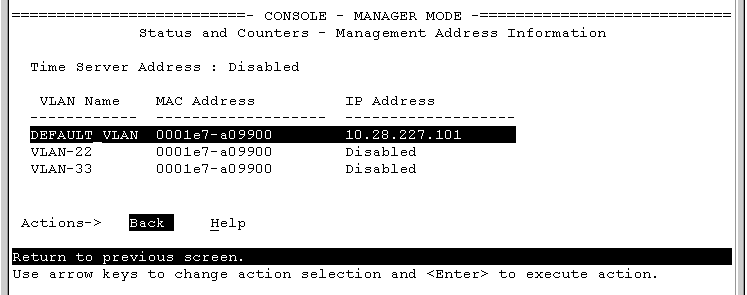
This screen displays addresses that are important for management of the switch. If multiple VLANs are not configured, this screen displays a single IP address for the entire switch. See the online Help for details.
|
|
|
![[NOTE: ]](images/note.gif) |
NOTE: As shown in Example: of management address information with VLANs configured, all VLANs on the switches use the same MAC address. (This includes both the statically configured VLANs and any dynamic VLANs existing on the switch as a result of GVRP operation.) Also, the switches use a multiple forwarding database. When using multiple VLANs and connecting a switch to a device that uses a single forwarding database, such as a Switch 4000M, there are cabling and tagged port VLAN requirements. For more information on this topic, see "Multiple VLAN Considerations" in the "Static Virtual LANs (VLANs)" chapter of the Advanced Traffic Management Guide for your switch. |
|
|
The features described in this section enable you to determine the traffic patterns for each port since the last reboot or reset of the switch. You can display:
You can also reset the counters for a specific port.
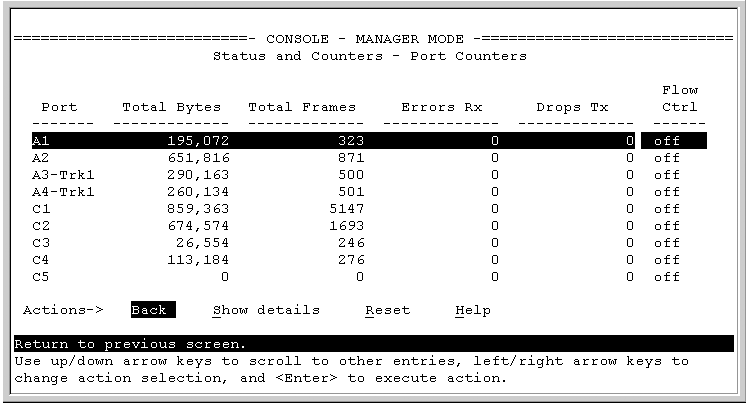
The menu interface provides a dynamic display of counters summarizing the traffic on each port. The CLI lets you see a static "snapshot" of port or trunk group statistics at a particular moment.
As mentioned above, rebooting or resetting the switch resets the counters to zero. You can also reset the counters to zero for the current session. This is useful for troubleshooting. See the Note, below.
|
|
|
![[NOTE: ]](images/note.gif) |
NOTE: The Reset action resets the counter display to zero for the current session, but does not affect the cumulative values in the actual hardware counters. (In compliance with the SNMP standard, the values in the hardware counters are not reset to zero unless you reboot the switch.) Exiting from the console session and starting a new session restores the counter displays to the accumulated values in the hardware counters. |
|
|
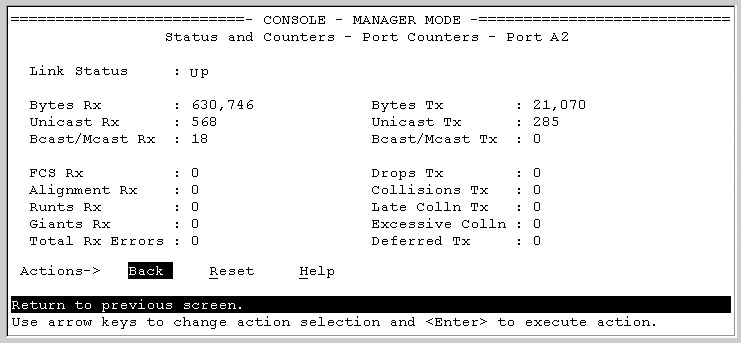
To view details about the traffic on a particular port, use the ↓ key to highlight that port number, then select Show Details. For example, selecting port A2 displays a screen similar to Example: of the display for Show Details on a selected port, below.
This screen also includes the Reset action for the current session.
|
|
|
![[NOTE: ]](images/note.gif) |
NOTE: Once cleared, statistics cannot be reintroduced. |
|
|
To display trunk counters information since the trunk was formed with the given ports. If ports are added or removed from the trunk-groups, statistical data is reset.
Syntax:
Ouptut for the show trunk-statistics command
HP Switch(config)# show trunk-statistics trk1

 Group : Trk1 Ports : 3,4
 Monitoring time : 23 hours 15 minutes

 Totals

  Packets Rx : 3,452,664 Bytes Rx : 14,004,243
  Packets Tx : 2,121,122 Bytes Tx : 2,077,566
  Packets Tx Drop :

  Rates (5 minute weighted average):
   Trunk utilization Rx : 30.2 %
   Trunk utilization Tx : 78.2 %

 Traffic Spread past 5 minutes

  Port | %Tx   | %Rx   | Bytes Rx   | Bytes Tx   | Dropped Frame-Tx
  ---- + ----- + ----- + ---------- + ---------- + ----------------
  3    | 27    | 42    | 1,223,445  | 2,112,122  | 123,122
  4    | 73    | 58    | 356,233    | 993,222    | 0
To display trunk counters information since the trunk was formed with the given ports. If ports are added or removed from the trunk-groups, statistical data is reset. The data is for a specific trunk.
Syntax:
It is useful to be able to clear all counters and statistics without rebooting the switch when troubleshooting network issues. The clear statistics global command clears all counters and statistics for all interfaces except SNMP. You can also clear the counters and statistics for an individual port using the clear statistics < command.port-list>
Syntax:
When executed with the
port-listoption, clears the counters and statistics for an individual port.When executed with the
globaloption, clears all counters and statistics for all interfaces except SNMP.
The show interfaces [< command displays the totals accumulated since the last boot or the last port-list>]clear statistics command was executed. The menu page also displays these totals.
SNMP displays the counter and statistics totals accumulated since the last reboot; it is not affected by the clear statistics global command or the clear statistics < command. An SNMP trap is sent whenever the statistics are cleared.port-list>
Syntax:
For example, to list the learned MAC address on ports A1 through A4 and port A6:
HP Switch# show mac-address a1-a4,a6
This feature lets you determine which switch port on a selected VLAN is being used to communicate with a specific device on the network.
-
Use the Space bar to select the VLAN you want, and then press [Enter].
The switch then displays the MAC address table for that VLAN (Example: of the address table).
This feature uses a device's MAC address that you enter to identify the port used by that device.
-
Proceeding from Example: of the address table, press [S] (for Search), to display the following prompt:
Enter MAC address: _
-
Enter the MAC address you want to locate and press [Enter].
The address and port number are highlighted if found (Example: of menu indicating located MAC address). If the switch does not find the MAC address on the currently selected VLAN, it leaves the MAC address listing empty.
-
Press [P] (for Prev page) to return to the full address table listing.
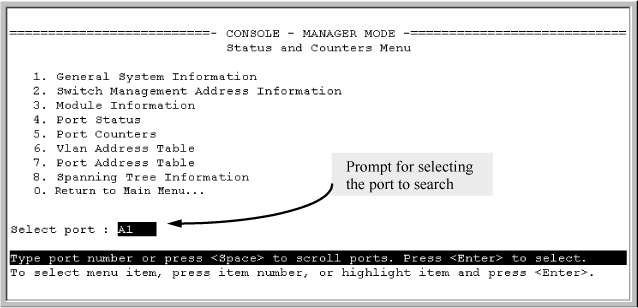
This feature displays and searches for MAC addresses on the specified port instead of for all ports on the switch.
Proceeding from step 2, above:
-
Press [S] (for Search), to display the following prompt:
Enter MAC address: _
-
Enter the MAC address you want to locate and press [Enter].
The address is highlighted if found. If the switch does not find the address, it leaves the MAC address listing empty.
-
Press [P] (for Prev page) to return to the previous per-port listing.
Syntax:
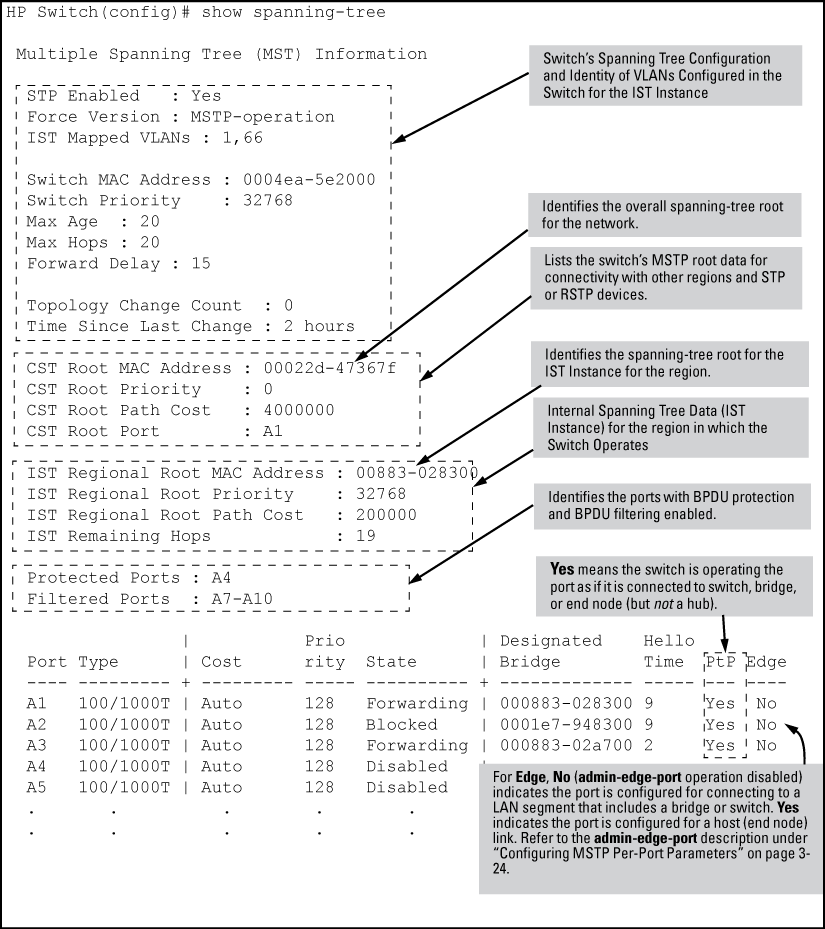
Displays the switch's global and regional spanning-tree status, plus the per-port spanning-tree operation at the regional level.
Values for the following parameters appear only for ports connected to active devices:
Designated Bridge,Hello Time,PtP, andEdge.
Example:
The switch uses the CLI to display the following IGMP status on a per-VLAN basis:
| Show command | Output |
|---|---|
show ip igmp |
Global command listing IGMP status for all VLANs configured in the switch:
|
show ip igmp config |
Displays the IGMP configuration information, including VLAN ID, VLAN name, status, forwarding, and Querier information. |
show ip igmp < |
Per-VLAN command listing above, IGMP status for specified VLAN (VID) |
show ip igmp group < |
Lists the ports currently participating in the specified group, with port type, Access type, Age Timer data and Leave Timer data. |
show ip igmp groups |
Displays VLAN-ID, group address, uptime, expiration time, multicast filter type, and the last reporter for IGMP groups. |
show ip igmp statistics |
Displays IGMP operational information, such as VLAN IDs and names, and filtered and flooding statistics. |
Output from show ip igmp config command
HP Switch(config)# show ip igmp config

 IGMP Service

                      IGMP    Forward with  Querier Querier
 VLAN ID VLAN Name    Enabled High Priority Allowed Internal
 ------- ------------ ------- ------------- ------- --------
 1       DEFAULT_VLAN No      No            Yes     125
 2       VLAN2        Yes     No            Yes     125
 12      New_VLAN     No      No            Yes     125
IGMP statistical information
HP Switch(vlan-2)# show ip igmp statistics

 IGMP Service Statistics

  Total VLANs with IGMP enabled               : 1
  Current count of multicast groups joined    : 1


 IGMP Joined Groups Statistics

  VLAN ID VLAN Name                        Filtered     Flood
  ------- -------------------------------- ------------ ------------
  2       VLAN2                            2            1
| Show command | Output |
|---|---|
show vlan |
Lists:
|
show vlan < |
For the specified VLAN, lists:
|
Example:
Suppose that your switch has the following VLANs:
The next three examples show how you could list data on the above VLANs.
Listing the VLAN ID (vid) and status for specific ports
HP Switch# show vlan ports A1-A2

 Status and Counters = VLAN Information - for ports A1,A2

  802.1Q VLAN ID Name         Status
  -------------- ------------ ------
  1              DEFAULT_VLAN Static
  33             VLAN-33      Static
Note: Because ports A1 and A2 are not members of VLAN-44, it does not appear in this listing.
VLAN listing for the entire switch
HP Switch# show vlan
 Status and Counters = VLAN Information

 VLAN support : Yes
 Maximum VLANs to support : 9
 Primary VLAN: DEFAULT_VLAN

 802.1Q VLAN ID Name         Status
 -------------- ------------ ------
 1              DEFAULT_VLAN Static
 33             VLAN-33      Static
 44             VLAN-44      Static
Port listing for an individual VLAN
HP Switch(config)# show vlan 1

 Status and Counters - VLAN Information - VLAN 1

  VLAN ID : 1
  Name : DEFAULT_VLAN
  Status : Static
  Voice : Yes
  Jumbo : No

  Port Information Mode     Unknown VLAN Status
  ---------------- -------- ------------ ------
  A1               Untagged Learn        Up
  A2               Untagged Learn        Up
  A3               Untagged Learn        Up
  A4               Untagged Learn        Down
  A5               Untagged Learn        Up
  A6               Untagged Learn        Up
  A7               Untagged Learn        Up
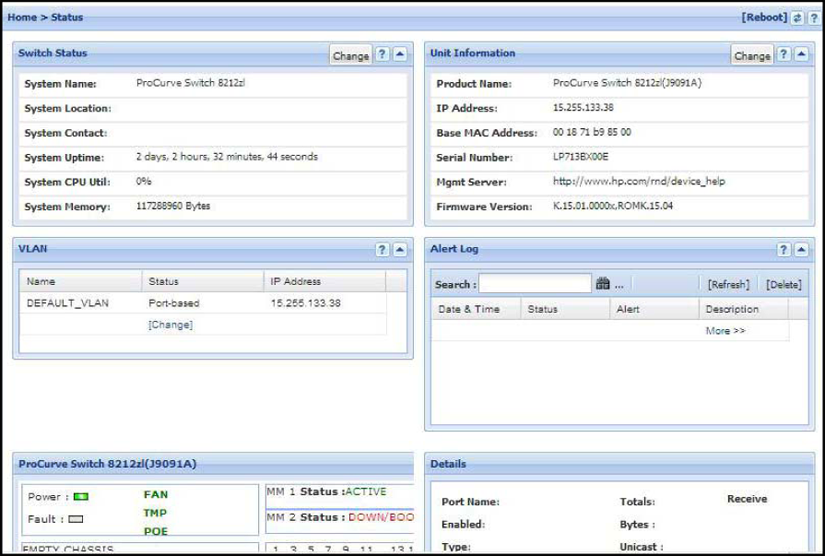
The WebAgent Status screen provides an overview of the status of the switch. Scroll down to view more details. For information about this screen, click on ? in the upper right corner of the WebAgent screen. For an Example: of a status screen, see Example: of a WebAgent status screen.
