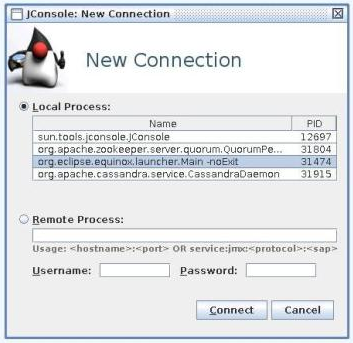
You can use JConsole or another JMX client to connect to the controller's JMX server to view metric data as it is updated in real time.
The jmx field of the MetricDescriptor used to create the TimeStampedMetric determines whether or not the metric can be viewed using a JMX client.
The content exposed for each TimeStampedMetric is contingent on the type of TimeStampedMetric, but generally speaking the most current values used by the TimeStampedMetric are visible as they are updated by the creator of the TimeStampedMetric.
For JMX clients to connect to the JMX server of the controller, the following conditions must be true:
The JMX client must be installed on the same system as the controller.
No JMX clients are included with the controller or are among the prerequisites for installing it; they must be installed separately. For example, to use the JConsole JMX client, the
openjdk-7-jdkpackage must be installed on the same system as the controller.The controller must be configured to permit local JMX access.
For more information about using JConsole and configuring local JMX access, see the JConsole documentation provided by Oracle at:
http://docs.oracle.com/javase/7/docs/technotes/guides/management/jconsole.html
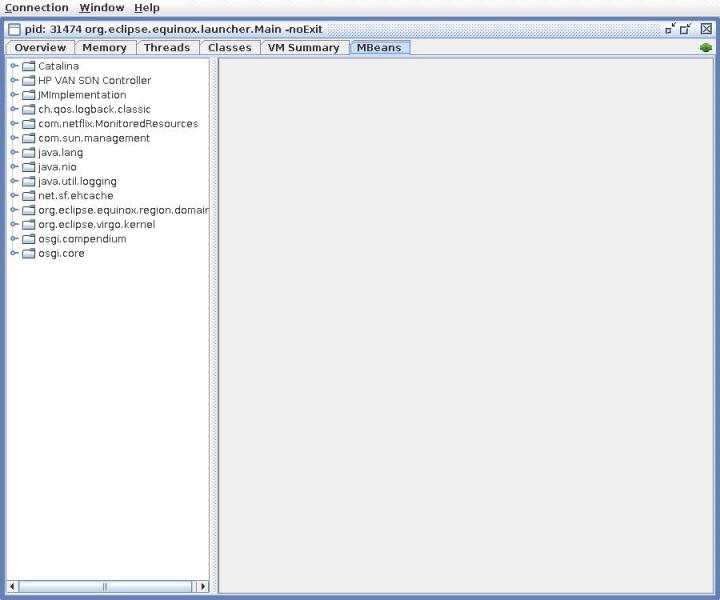
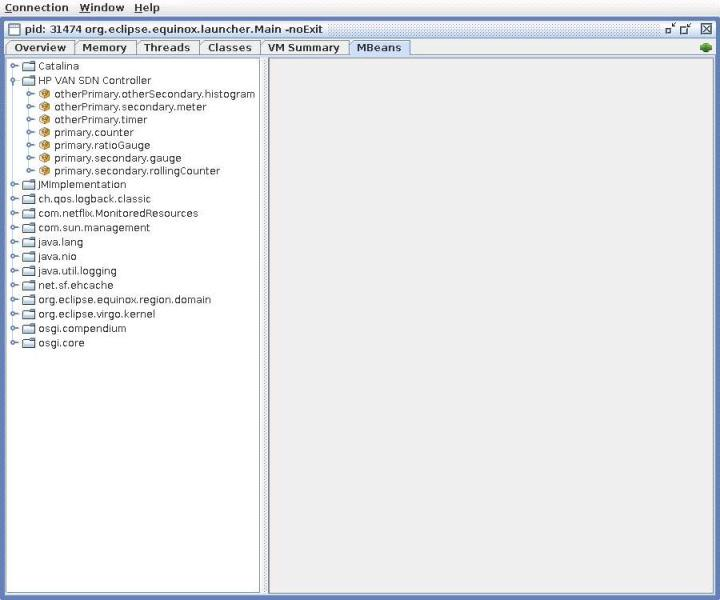
To display the metrics for an application, expand the application folder in the left pane:
To view metrics for the HP VAN SDN Controller and its embedded applications, expand the folder named HP VAN SDN Controller.
To view metrics for an application installed on the controller, expand the folder for the application.
Each application installed on the HP VAN SDN Controller has a similar node under which all of the metrics exposed by that application are nested.
Figure 51 shows an example of the expanded HP VAN SDN Controller application folder with the metrics displayed. Other applications that expose JMX metrics have folders that are separate from the folder for the HP VAN SDN Controller.
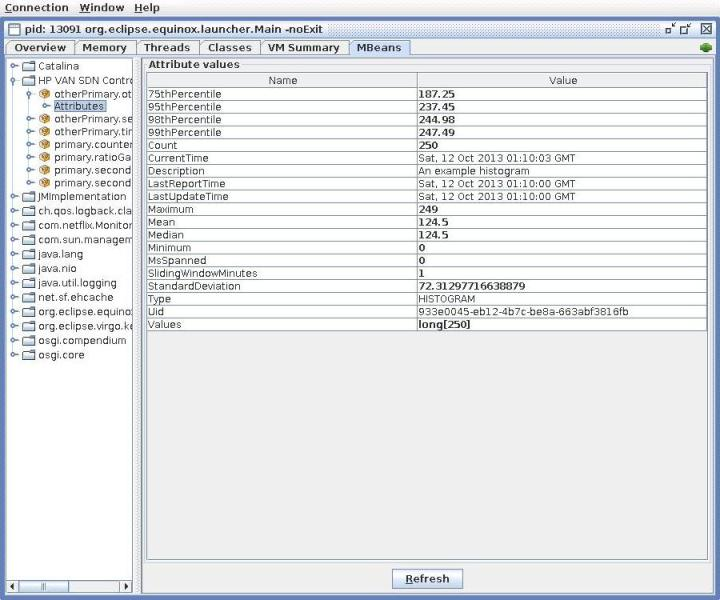
Expand the metric you want to view.
The name displayed for each
TimeStampedMetricis a combination of the application ID, metric name, and (optional) primary and secondary tags that were specified during the creation of itsMetricDescriptor. This combination is unique among allTimeStampedMetricinstances monitored for a specific application. If the optional primary and secondary tags are not specified, the fields that are provided are used to formulate the displayed name for theTimeStampedMetric.Select Attributes to display
TimeStampedMetricproperties that are exposed via JMX.Figure 52 shows an example of displaying the attributes for a metric.
For those
TimeStampedMetricinstances that are persisted as well as exposed via JMX, it is possible to see the value for MsSpanned (milliseconds spanned) get reset when the value is stored; otherwise the value continues to increase. For persistedTimeStampedMetric, MsSpanned indicates the number of milliseconds that have accrued during the persistence interval that is underway but not yet complete.