System — Stack
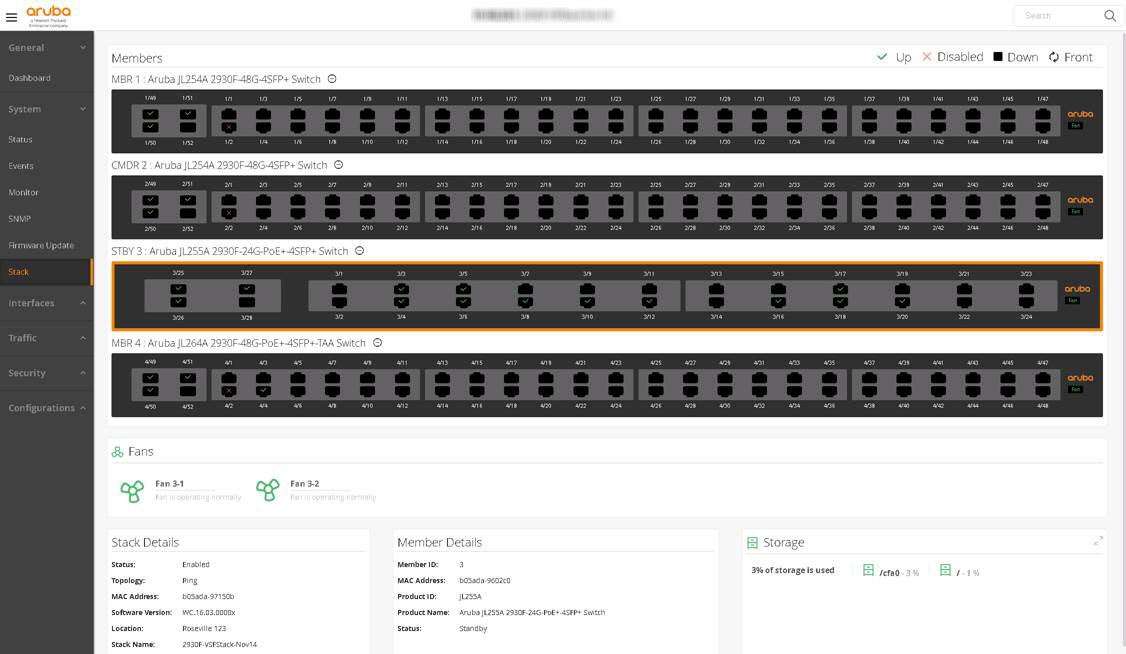
This view is only present on switch stacks.
Box Graphic: Displays each stack member physically.
-
Used to view member information.
-
The switch outlined in orange is the currently selected member.
-
Data on the page reflects the selected member.
-
The Box Graphic can be flipped to show either the front or back of the switch.
Fans: Displays member fan status.
Status:
-
Green: The current system storage use is within normal range.
-
Yellow: The current system storage use exceeds the warning threshold of 70%.
-
Red: The current system storage use exceeds the critical threshold of 90%.
Storage: Displays system storage status.
Status:
-
Green: All fans are operating normally.
-
Yellow: One or more fans have failed but the number of failures does not exceed 50% of all system fans.
-
Red: At least 50% of the system fans have failed.
Temperature: Displays system temperature status.
Status:
-
Green: The current system temperature is within normal range.
-
Yellow: The current system temperature exceeds the warning threshold of <variable>. The threshold is based on a user-controlled setting on the switch.
-
Red: The current system temperature exceeds the critical threshold of <variable>. The threshold is based on a user-controlled setting on the switch.
Power Supplies: Displays system power supply status.
Status:
-
Green: All power supplies are operating normally.
-
Yellow: One or more power supplies have failed but the number of failures does not exceed 40% of all system power supplies.
-
Red: At least 40% of the system power supplies have failed.
Stack Details: Displays system information regarding the stack including stack topology/configuration and software version on all members.
Member Details: Displays status, MAC address, location and stack name.
CPU: Displays the current CPU usage of the selected stack member.
-
The outer ring of the gauge indicates regions of normal, warning, and critical values.
-
The peak value shown on the inner ring indicates the highest CPU usage reached for the device.
Status:
-
Green: CPU usage is within normal range.
-
Yellow: CPU usage exceeds the warning threshold of 75%.
-
Red: CPU usage exceeds the critical threshold of 90%.
Memory: Displays current memory usage of the selected stack member.
-
The outer ring of the gauge indicates regions of normal, warning, and critical values.
-
The peak value shown on the inner ring indicates the highest memory usage reached for the device.
Status:
-
Green: Memory usage is within normal range.
-
Yellow: Memory usage exceeds the warning threshold of 75%.
-
Red: Memory usage exceeds the critical threshold of 90%.
Packet Buffers: Displays current packet buffer usage.
-
The outer ring of the gauge indicates regions of normal, warning, and critical values.
-
The peak value shown on the inner ring indicates the highest packet buffer usage reached for the device.
Status:
-
Green: Packet buffer usage is within normal range.
-
Yellow: Packet buffer usage exceeds the warning threshold of 85%.
-
Red: Packet buffer usage exceeds the critical threshold of 95%.
Tx Drops: Displays current transmit drop rate.
-
The outer ring of the gauge indicates regions of normal, warning, and critical values.
-
The peak value shown on the inner ring indicates the highest transmit drop rate reached for the device.
Status:
-
Green: Transmit drop rate is within normal range.
-
Yellow: Transmit drop rate exceeds the warning threshold of 3% of transmit attempts.
-
Red: Transmit drop rate exceeds the critical threshold of 5% of transmit attempts.
Message Buffers: Displays current message buffer usage.
-
The outer ring of the gauge indicates regions of normal, warning, and critical values.
-
The peak value shown on the inner ring indicates the highest message buffer usage reached for the device.
Status:
-
Green: Message buffer usage is within normal range.
-
Yellow: Message buffer usage exceeds the warning threshold of 75%.
-
Red: Message buffer usage exceeds the critical threshold of 90%.
Rx Errors: Displays the current receive error rate.
-
The outer ring of the gauge indicates regions of normal, warning, and critical values.
-
The peak value shown on the inner ring indicates the highest receive error rate reached for the device.
Status:
-
Green: Receive error rate is within normal range.
-
Yellow: Receive error rate exceeds the warning threshold of 2% of received frames.
-
Red: Receive error rate exceeds the critical threshold of 5% of received frames.