System — Monitor
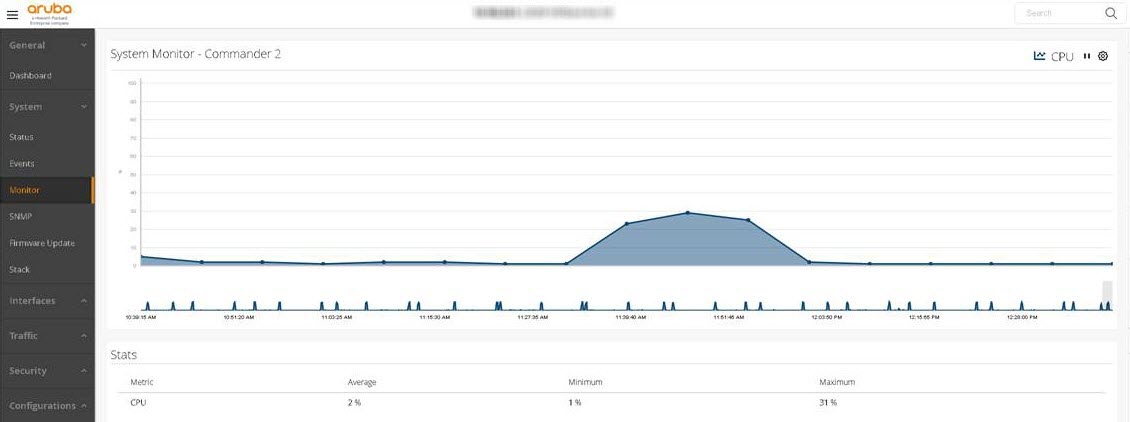
Monitors up to six system metrics at a given time.
-
Metrics include:
-
CPU usage
-
Memory usage
-
Packet buffer usage
-
Transmit drop rate
-
Message buffer usage
-
Receive error rate
-
-
Metrics can be hidden from the graph by selecting the corresponding graph icon in the toolbar at the top of the graph.
-
Select and slide the minimap (the gray box at the bottom of the graph) to zoom in and out of the graph. You can also focus in on a specific portion of the graph.
-
Zooming in will provide a finer granularity of displayed data points, while zooming out will display fewer data points.
Pause and Play Graph: Use the pause and play icons in the toolbar in the upper right corner of the graph to start and stop the display of data points on the current graph.
-
Pausing the graph will not pause the collection of system monitor data.
-
Upon restarting the graph, the data points collected while the graph was paused will be filled in.
Graph options: Select the Graph Settings icon in the upper right corner of the graph to:
-
View system monitor graph options
-
Select metrics to graph
-
Show/hide system alerts
-
Show/hide summary lines (maximum, minimum, and average)
The Metrics Statistics: Displays statistics for each of the currently graphed metrics. Statistics include average, maximum, and minimum values for the metric.