Viewing report charts
- On the main menu, select System Reporter > Reports.
- In the list pane, select the report.
- Tip: The list can appear to be empty depending on the filters that are selected.
- Select the Charts view (1).
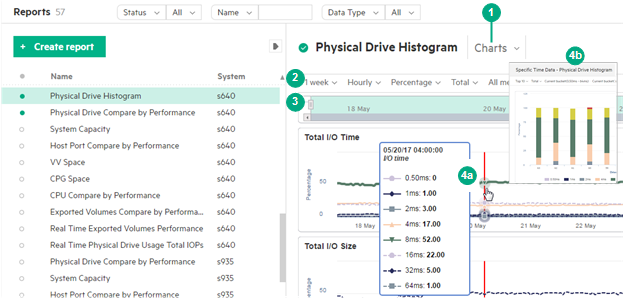
Interactive controls for chart metrics (2) are displayed under the report title. You can use the controls to change the data that is displayed in the chart.
To save the applied changes to an existing report, you can select the Save or Save As option. The Save option is available only to the author of the report.
A chart timeline and zoom bar (3) are displayed near the top of the detail pane.
As you move the cursor along chart graphics, a popup shows details (4a). On historical charts that span a time interval, clicking directly on a graphic element displays a Specific Time Data report (4b) for that point on the timeline.
Moving charts. To move an individual chart up or down, hover over the chart title until the move icon appears (![]() ), then drag and drop the chart in a new location.
), then drag and drop the chart in a new location.
Maximizing and minimizing charts. To maximize or minimized charts, click the maximize or minimize icon (
![]() ) at the right side of the interactive controls.
) at the right side of the interactive controls.
Displaying charts in separate windows. To display charts in a separate browser window, click the pop out icon (![]() if available) at the right side of the interactive controls.
if available) at the right side of the interactive controls.
Learn more: Zooming into charts, Using real time reports.