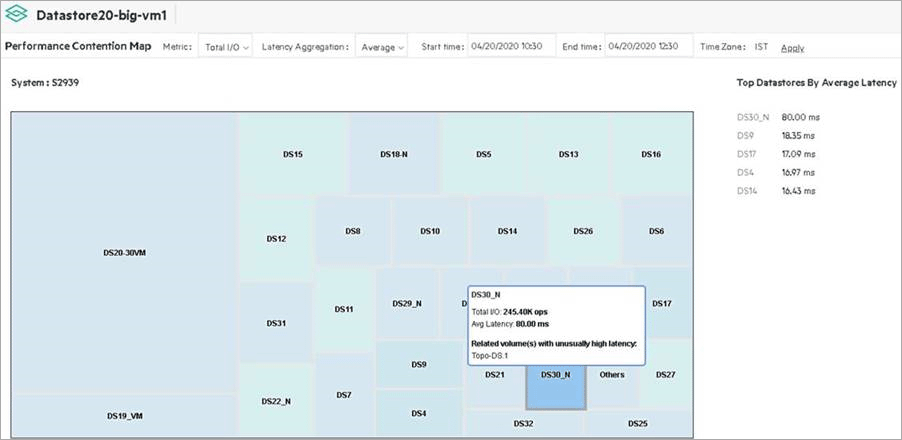
Performance Contention Map
Datastore, ESXi host, and system boxes have a contention icon (![]() ) on top-right corner. Click the contention icon displays the corresponding contention map. The contention map helps in understanding the impact of the neighboring datastores and VMs impact on the IO. By default, the selected time period
) on top-right corner. Click the contention icon displays the corresponding contention map. The contention map helps in understanding the impact of the neighboring datastores and VMs impact on the IO. By default, the selected time period
+/- an hour relative to the time selected on the topology slider.

For a datastore, the performance of the respective VMs appears. For a host or system, it starts with the performance of the respective datastores. Click a datastore in the performance contention map details the performance of the respective VMs.
The area of a block corresponds to total I/O or amount of data transferred.
The color of a block corresponds to latency.
If an underlying volume of a datastore is identified to have unexplained high latency during the selected duration, then moving the cursor over the datastore displays the tooltip with relevant information.
You can click a datastore and drill down to the data of the corresponding VMs.
By default, the top 29 datastores or VMs by total I/O and average method for latency aggregate are displayed. The rest of the datastores or VM data is combined as
Others. Others total I/O is the addition of the I/Os of all the remaining entities whereas, the latency is the maximum among latency of all the remaining entities.Total I/O or amount of data transferred is calculated based on the vCenter related files that SSMC has received from Service Processor (SP) or Primera. I/O is the summation of read and write I/Os for the selected time duration. The amount of data transfer is the summation of read and write capacities. The average latency is the weighted average of the 5 minutes average latency reported for read and write values.
SP or Primera collects data from vCenter at a granularity of 20 seconds. SSMC gets relevant performance data of objects from SP or Primera.
In SSMC, the simple average of all the data points is calculated and stored for a duration of approximately seven days.
For an IOPS and throughput of VM, summation of constituent VMDKs' IOPS and throughput is stored.
For a latency of VM, maximum value within constituent VMDKs' latencies is stored.
Total IOs or amount of data transfer of a VM is calculated as summation of all corresponding five-minute read and write IOPS/Throughput * 300.
Total average latency of the VM is calculated using the single weighted latency value by weighing read and write latencies over its IOPS counterpart for a duration of every five minutes and then deriving a simple average.
If the maximum value is derived from the latency aggregation method, then the total maximum latency of the VM is calculated by considering the maximum of all the corresponding five minutes read and write values.
Calculation in datastore context is similar to that of VMs. In datastore context for latency, the device read and write latencies are considered.