Dashboard of the HPE StoreEasy management console

The Dashboard provides a visual representation of the general health and capacity of the HPE StoreEasy 1000 Storage.

The dashboard metrics include:

  • General health status of all logical and physical components.

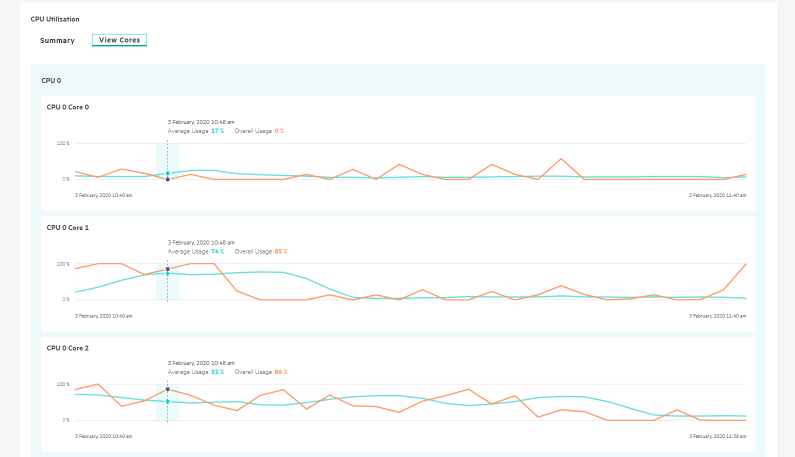
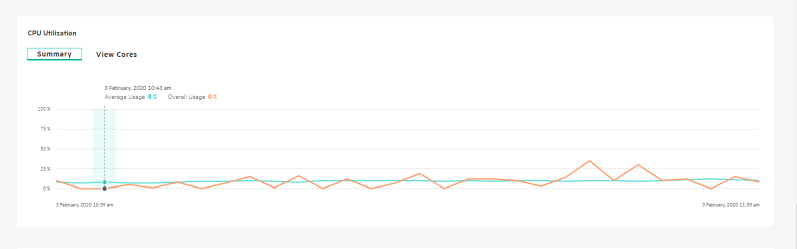
  • Overall CPU, memory, and storage utilization.

  • Current network utilization for read and write operations.

The Dashboard data is automatically updated every 30 seconds.

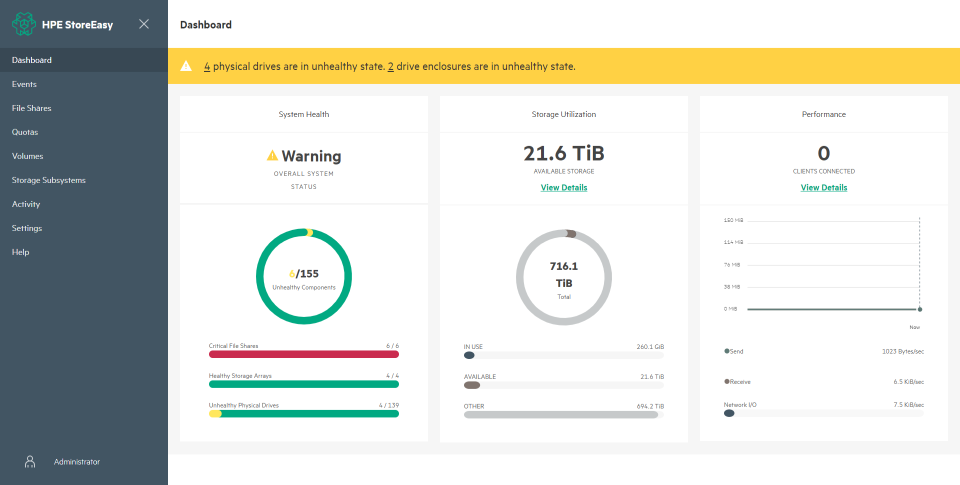
The notification banner displays the health status messages. If the state is either Warning or Critical, use the hyperlinks provided to drill down further to find the cause of the degraded or faulty states.

The following are the different status icons:

  • Green for OK ()

  • Red for critical ()

  • Yellow for warning ()

  • White for unknown ()

The following table details the information provided in the Dashboard page.
Dashboard Components Description
Health

Displays the health of the managed resources, such as file shares, arrays, and physical drives.

To see the list for a specific resource or event, click the color-coded bar under that resource or select the resource or event from the left navigation pane.

The following color coding is used to represent the health of the resources or the severity of the events:
  • Green: Indicates a healthy resource.

  • Yellow: Indicates an unhealthy resource that has warnings and could move to the critical state.

  • Red: Indicates an unhealthy resource that is in critical state, and requires your immediate attention.

Storage Utilization

Displays the storage utilization and capacity trends for the following:

Available

Indicates that the storage resource is available.

In use

Indicates that the storage resource is in use.

Other

Indicates the Total capacity available without Presented capacity, which is the capacity with RAID applied, and Capacity of the C: volume. It includes RAID overhead and the system overhead (OS).

Total

Indicates the total capacity of all drives. It is the total capacity available.

Estimated days to capacity full

Indicates the number of days remaining for the capacity to reach maximum usage. The capacity prediction is calculated based on the in use capacity trend for a minimum of 30 days. For this time period, the estimated days of saturation will not be available.

Daily growth rate

Indicates the change in capacity on a daily basis.

You can also view the storage utilization information in charts. You can move the slider bar on the chart:

  • To view the utilization at a specific date and time.

  • To set the threshold for the storage consumption using the slider bar.

Whenever there is a huge variation in the In Use, Available, and Other capacities, the total of these capacities may not be accurate or add up to 100%.

Capacity shortage notification emails are sent when the threshold is reached.

The historical data for storage utilization is also available.

For more information about the historical data, see Setting the date range to display historical data.

Performance
IOPS

Displays the Input/output operations per second (IOPS).

You can also view the performance information in charts. You can move the cursor on the chart to view the performance at a specific date and time.

Current Network I/O

Displays the amount of Network Utilization used by the resources, which is the total read and write bandwidth used at the current moment.

  • Current Read bandwidth: Current network read bandwidth across all connected and active network links.

  • Current write bandwidth: Current networks write bandwidth across all connected and active network links.

Current CPU Utilization

Displays the current CPU utilization for all cores in the processor of the HPE StoreEasy 1000 Storage systems.

Current Memory Utilization

Displays the current memory utilization of all the processes running on the HPE StoreEasy 1000 Storage systems.

Clients connected

You can view the number of users currently using the HPE StoreEasy 1000 Storage systems.

Historical CPU Utilization

Displays the historical CPU utilization data for all cores in the processor of the HPE StoreEasy 1000 Storage systems for a set time period.

Historical memory (RAM) utilization
Displays the historical memory (RAM) utilization data for the HPE StoreEasy 1000 Storage systems for a set time period. The following memory (RAM) utilization data is available.
Memory In Use
Hardware reserved

Reserved memory for hardware such as System BIOS, PCIe bus, Motherboard resources, Audio and Video cards, memory and other chipsets. You cannot change the memory details without changing the hardware configuration of your system.

In Use

Amount of memory used by the Operating System, application processes running and firmware drivers.

Modified

Memory where pages have been written to but not accessed recently. If the modified memory is not accessed for longer time, then the memory manager writes this data into Stand By memory.

Available Memory
Standby

Contains data that has been cached. Standby memory is not used actively by any processes.

Free

Memory available for allocation for any new process requests.

For more information about the historical data, see Setting the date range to display historical data.

View process data

It shows that the process data collected every 5 seconds.

It displays the Process name, Windows Service or Application name, and CPU and Memory utilization at that instant.

You can apply the time filters to adjust for the amount of data you want to view. By default, it shows data for 5 minutes.

You can sort in descending order for CPU or Memory utilization to review data on which service or application is consuming most resources.