Dashboard overview
The Dashboard of the HPE StoreEasy management console provides a visual representation of the general health and capacity of the HPE StoreEasy system. The Dashboard provides:
General health status of all logical and physical components.
Overall CPU, memory, and storage utilization.
Current performance levels read and write network bandwidth.
Each time that you log in to the management console, the Dashboard is the first screen displayed and the data is automatically updated every 30 seconds.
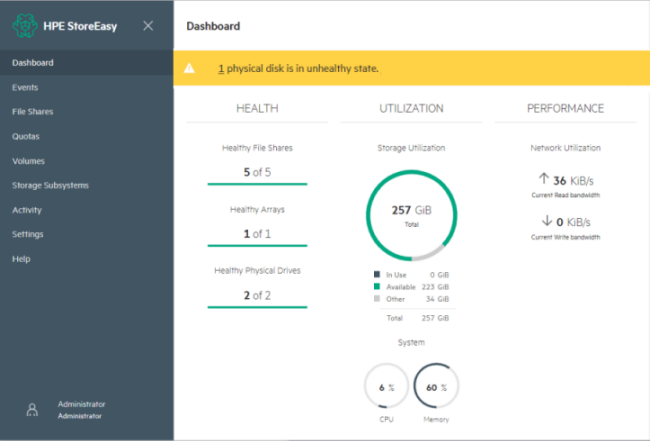
A notification banner displays at the top of the Dashboard page that provides the overall state and health status of the system. If a resource is in a warning or critical status, click the resource (typically a number) to go to the selected resource page. You can view and determine the cause for the warning or critical status.
The following are the different status icons that depict the overall health status of the resources and components:
Green for OK (
 )
)
Red for critical (
 )
)
Yellow for warning (
 )
)
White for unknown (
 )
)
The following table details the information provided in the Dashboard page.
| Dashboard Components | Description |
|---|---|
| Health | The health of the managed resources (such as file shares, arrays, and physical drives). The number of healthy resources out of the total number of resources is displayed. To see the list for a specific resource or event, click the color-coded bar under that resource or select the resource or event from the left navigation pane. The following color coding is used to represent the health of the resources or the severity of the events:
|
| Utilization | The storage, CPU, and memory utilization of the HPE StoreEasy system. The following color coding is used to represent the types of Storage Utilization:
|
| Performance | Displays the amount of Network Utilization used by the resources, which is the total read and write bandwidth used at the current moment.
|
 ): Indicates the storage utilization in use.
 ): Indicates that the storage utilization is available.
 ): Indicates the other storage utilization.