Next Generation UI functionality
The toolbar in the upper right corner of the screen displays four icons:
Notifications: Click this icon to see a list of alerts.
Help: Click this icon to see the help text associated with the current screen.
User Details: Click this icon to see a list of user roles. You can also launch the Legacy user interface by clicking the Launch Legacy GUI button.
Settings: Click this icon to modify the web interface settings.
The Next Generation UI displays four areas of functionality:
General (Overview and Alerts)
System (Monitor)
Ports (Management)
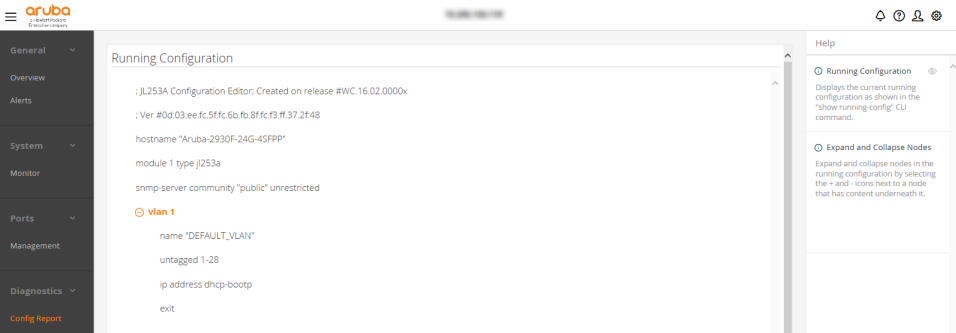
Diagnostics (Config Report)
General: Overview
Displays an overview of system information and switch performance.
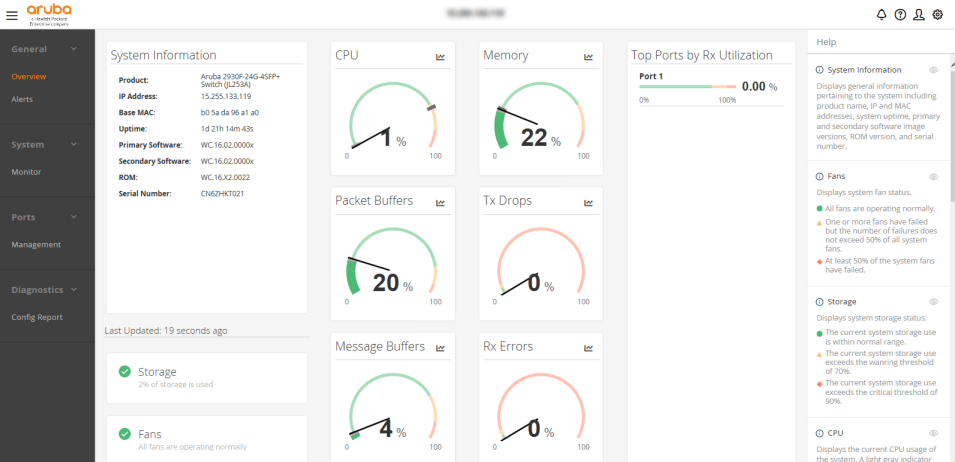
System Information: Displays general system information, including product name, IP and MAC addresses, system uptime, primary and secondary software image versions, ROM version, and serial number.
Fans: Displays system fan status.
Green: All fans are operating normally.
Yellow: One or more fans have failed but the number of failures does not exceed 50% of all system fans.
Red: At least 50% of the system fans have failed.
Storage: Displays system storage status.
Green: The current system storage use is within normal range.
Yellow: The current system storage use exceeds the warning threshold of 70%.
Red: The current system storage use exceeds the critical threshold of 90%.
CPU: Displays the current CPU usage. A light gray indicator marks the average and a dark gray indicator marks the highest value during the interval for which data is tracked.
Green: CPU usage is within normal range.
Yellow: CPU usage exceeds the warning threshold of 75%.
Red: CPU usage exceeds the critical threshold of 90%.
Memory: Displays the current memory usage. A light gray indicator marks the average and a dark gray indicator marks the highest value during the interval for which data is tracked.
Green: Memory usage is within normal range.
Yellow: Memory usage exceeds the warning threshold of 75%.
Red: Memory usage exceeds the critical threshold of 90%.
Packet Buffers: Displays the current packet buffer usage. A light gray indicator marks the average and a dark gray indicator marks the highest value during the interval for which data is tracked.
Green: Packet buffer usage is within normal range.
Yellow: Packet buffer usage exceeds the warning threshold of 85%.
Red: Packet buffer usage exceeds the critical threshold of 95%.
Tx Drops: Displays the current transmit drop rate. A light gray indicator marks the average and a dark gray indicator marks the highest value during the interval for which data is tracked.
Green: Transmit drop rate is within normal range.
Yellow: Transmit drop rate exceeds the warning threshold of 3% of transmit attempts.
Red: Transmit drop rate exceeds the critical threshold of 5% of transmit attempts.
Message Buffers: Displays the current message buffer usage. A light gray indicator marks the average and a dark gray indicator marks the highest value during the interval for which data is tracked.
Green: Message buffer usage is within normal range.
Yellow: Message buffer usage exceeds the warning threshold of 75%.
Red: Message buffer usage exceeds the critical threshold of 90%.
Rx Errors: Displays the current receive error rate. A light gray indicator marks the average and a dark gray indicator marks the highest value during the interval for which data is tracked.
Green: Receive error rate is within normal range.
Yellow: Receive error rate exceeds the warning threshold of 2% of received frames.
Red: Receive error rate exceeds the critical threshold of 5% of received frames.
Top Ports by Rx Utilization: Displays the top five ports with the highest receive utilization. Only ports that are enabled and up will be shown.
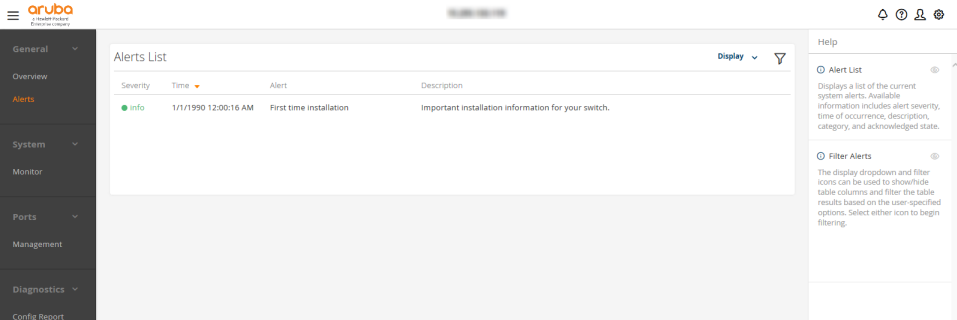
General: Alerts
Displays a list of the current system alerts. Available information includes alert severity, time of occurrence, description, category, and acknowledged state. The display drop-down and filter icon can be used to show/hide table columns and filter the results based on the user-specified options. Select either tool to begin filtering.
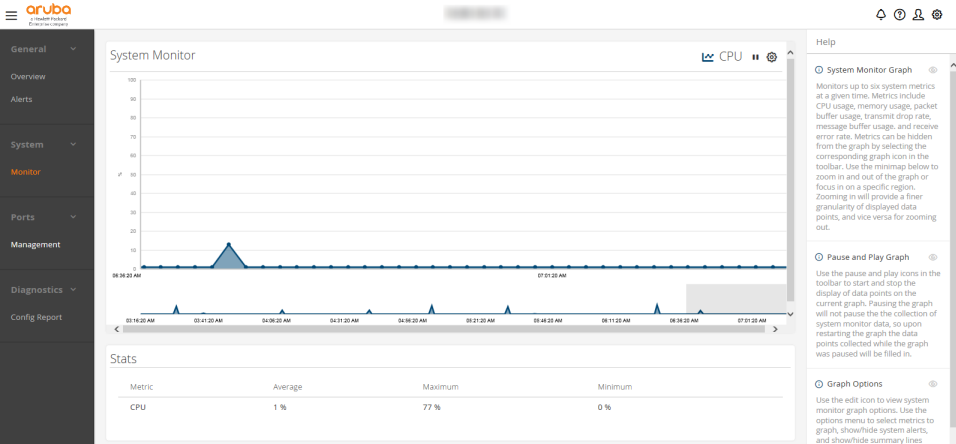
System: Monitor
Monitors up to six system metrics at a given time. Metrics include CPU usage, memory usage, packet buffer usage, transmit drop rate, message buffer usage, and receive error rate. Metrics can be hidden from the graph by selecting the corresponding graph icon in the toolbar at the top of the graph. Select and slide the gray box at the bottom of the graph to zoom in and out of the graph or focus in on a specific portion of the graph. Zooming in will provide a finer granularity of displayed data points, while zooming out will display fewer data points.
A series of icons in the upper right corner of the graph allow you to customize the System Monitor graph:
Select the show/hide icon to display and hide graph data.
Select the pause/play icon to pause and start the display of data points on the current graph. Pausing the graph will not pause the collection of system data, so upon restarting the graph, the data points collected while the graph was paused will be filled in.
Select the graph settings icon to view system monitor graph options, select metrics to graph, show/hide system alerts, and show/hide summary lines (maximum, minimum, and average).
![[NOTE: ]](images/note.gif) | NOTE: There is no functionality behind the CPU icon at this time. |
The Stats table displays statistics for each of the currently graphed metrics. Statistics include average, maximum, and minimum values for the metric.
Ports: Management
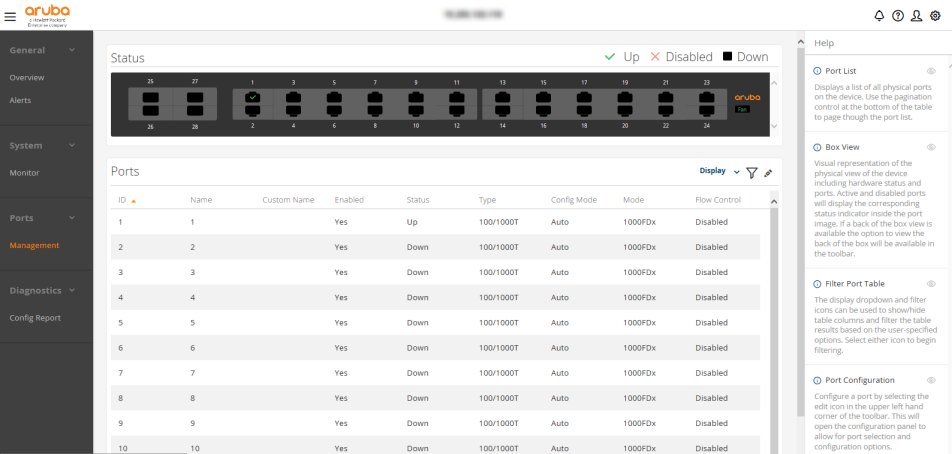
Status provides a visual representation of the physical view of the device including hardware status and ports. Active and disabled ports display the corresponding status indicator inside the port image. If a back of the box view is available, the option to view the back of the box will be available in the toolbar at the top of the page.
Ports displays a list of all physical ports on the device. Use the pagination control at the bottom of the table to page though the port list. Three tools in the upper right corner of the Ports area of the screen allows you to customize the ports view.
The Display drop-down and the filter icon can be used to show or hide table columns and filter the table results based on the user-specified options. Select either tool to begin filtering.
Configure a port by selecting the edit ports (pencil) icon. The configuration panel opens, allowing you select ports and configure options.