This section describes the status and counters screens available through the switch console interface and/or the WebAgent.
|
|
|
![[NOTE: ]](images/note.gif) |
NOTE: You can access all console screens from the WebAgent via Telnet to the console. Telnet access to the switch is available in the Device View window under the Configuration tab. |
|
|
Beginning at the Main Menu, display the Status and Counters menu by selecting:
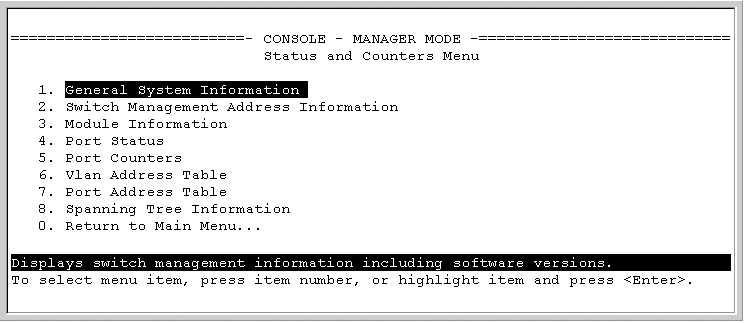
Each of the above menu items accesses the read-only screens described on the following pages. See the online help for a description of the entries displayed in these screens.
Syntax
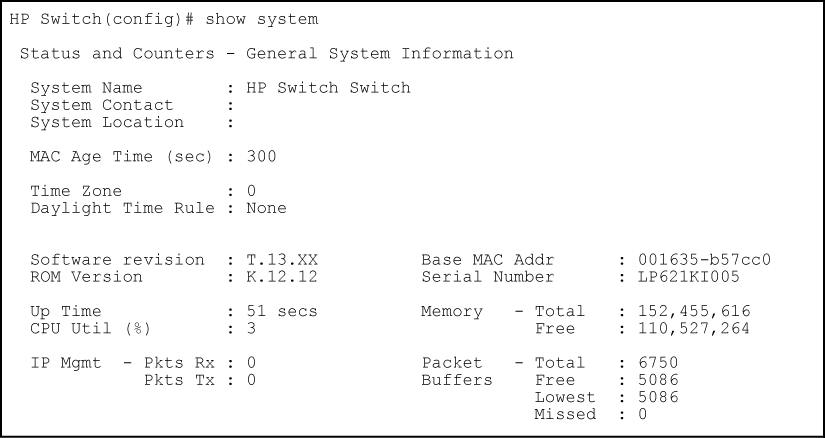
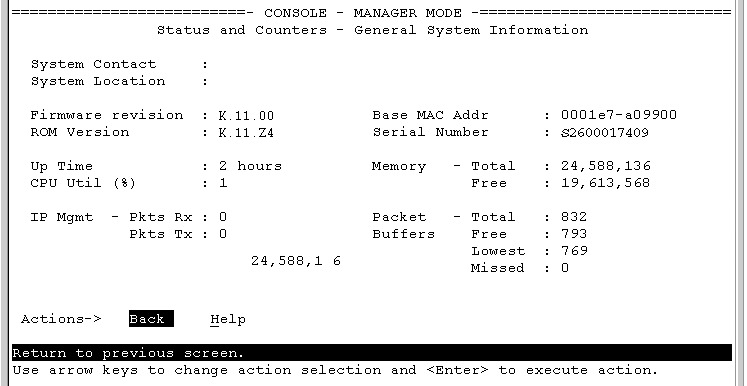
Displays global system information and operational parameters for the switch.
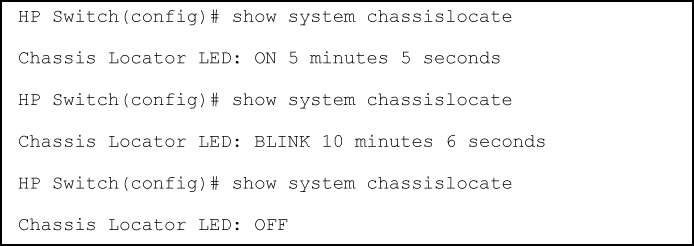
chassislocateDisplays the chassisLocator LED status. Possible values are ON, Off, or Blink.
When the status is On or Blink, the number of minutes that the Locator LED will continue to be on or to blink is displayed. (See figure Command results for show system chassislocate command.)
informationDisplays global system information and operational parameters for the switch. (See Switch system information.)
power-supplyShows chassis power supply and settings.
temperatureShows system temperature and settings.
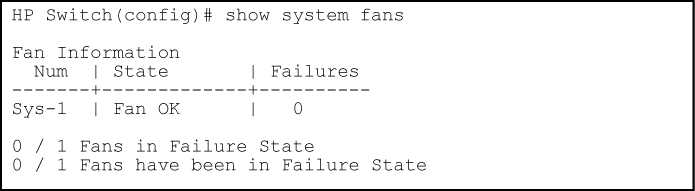
fansShows system fan status. (See System fan status.)
Example
To locate where a specific switch is physically installed, use the chassislocate command to actuivate the blue locator LED on the switch’s front panel.
Syntax
Locates a switch by using the blue locate LED on the front panel.
blink 1–1440 Blinks the chassis locate LED for a specified number of minutes (Default: 30 min.) on 1–1440 Turns the chassis locate LED on for a specified number of minutes (Default: 20 min.) off Turns the chassis locate LED off.
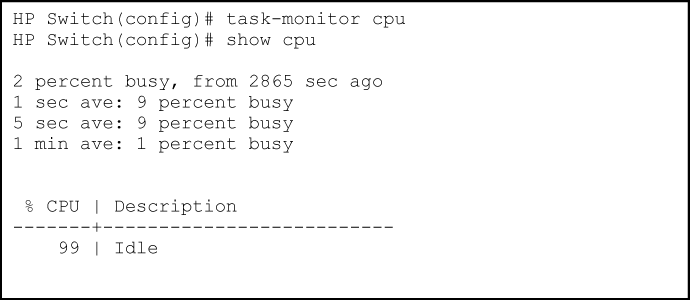
The task monitor feature allows you to enable or disable the collection of processor utilization data. The task-monitor cpu command is equivalent to the existing debug mode command taskusage -d. (The taskUsageShow command is also available.)
When the task-monitor command is enabled, the show cpu command summarizes the processor usage by protocol and system functions.
Syntax
Allows the collection of processor utilization data.
Only manager logins can execute this command.
The settings are not persistent, that is, there are no changes to the configuration.
The task monitor feature allows you to enable or disable the collection of processor utilization data. The
task-monitor cpucommand is equivalent to the existing debug mode commandtaskusage -d. (ThetaskUsageShowcommand is available as well.)When the
task-monitorcommand is enabled, theshow cpucommand summarizes the processor usage by protocol and system functions.
Example
From the console Main Menu, select:
This screen dynamically indicates how individual switch resources are being used. See the online Help for details.
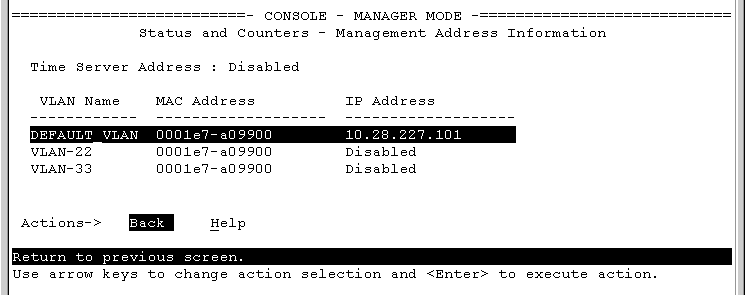
This screen displays addresses that are important for management of the switch. If multiple VLANs are not configured, this screen displays a single IP address for the entire switch. See the online Help for details.
|
|
|
|
|
NOTE: As shown in Example of management address information with VLANs configured, all VLANs on the switches use the same MAC address. (This includes both the statically configured VLANs and any dynamic VLANs existing on the switch as a result of GVRP operation.) Also, the switches use a multiple forwarding database. When using multiple VLANs and connecting a switch to a device that uses a single forwarding database, such as a Switch 4000M, there are cabling and tagged port VLAN requirements. |
|
|
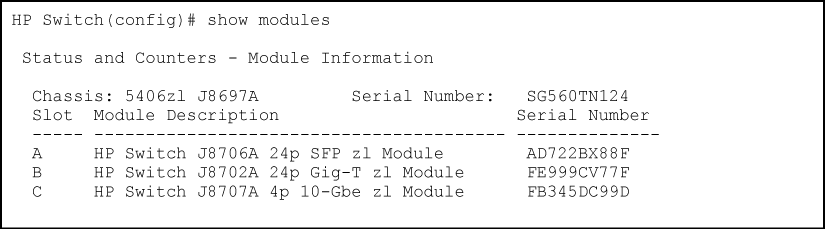
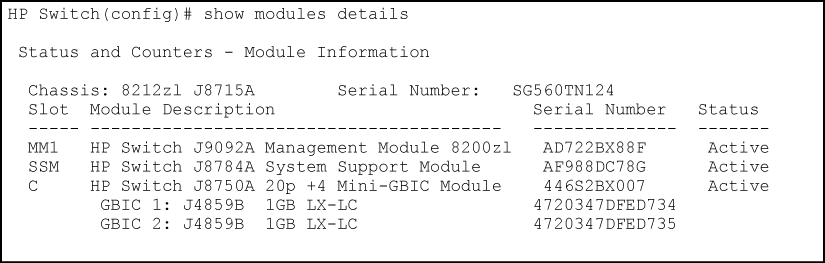
The CLI show modules command displays additional component information for the following:
Syntax
Displays information about the installed modules (The show modules command output), including:
Additionally, this command displays the part number (J number) and serial number of the chassis. (See The show modules details command for the 8212zl, showing SSM and mini-GBIC information.)
Examples
|
|
|
|
|
NOTE: On HP Switch 3500yl and 6200yl series switches, the mini-GBIC information does not display, because the ports are fixed and not part of any module. |
|
|