The SDN controller has a subsystem for tracking metric values over time. Metric values are help as a time series which becomes available to the user via JMX or may be persisted to disk. For metric values that are persisted to disk the time‐series values for each individual metric may be persisted at intervals of 1, 5, or 15 minutes; the component or application creating the metric may choose to use the default persistence. Each persisted value represents the value of the metric over the elapsed interval represented by the persisted value. Persisted metric values are retained on the controller disk for the period of time configured via the metric manager configuration, see “Metric manager component”. Persisted metric values may be extracted from the controller using a series of REST calls.
Persisted value
Consider the value of a counter that incremented from 100 to 145 during a 5 minute interval. By taking the value at the end of the interval (145), less the value at the start of the interval (100) the value persisted for the interval would be 45.
The amount of time during the interval over which the metric value was accrued is also persisted.
If the counter value was accrued over only the last 3 minutes of the 5 minute interval, then the normalized rate of accrual over the interval would be 15 counts per minute or 75 counts for the entire 5 minute interval.
The user can inspect the most recent value of the exposed metric using any JMX client (e.g. jconsole). The values exposed will show the absolute value of each such metric. Metric values that are retained only in memory and not exposed to the user via persistence and/or JMX may be used internally by a component or application.
The metric REST API consists of several distinct commands that may be used in combination to determine which metrics have persisted time‐series values resident on the controller, what each metric represents, and to retrieve time series values for specific metrics of interest. Note this API operates only on a single controller at a time; it is not team‐aware and does not return values that span a controller team. The metrics applications commands will display the application IDs – including the controller itself – that have persisted metrics to disk.
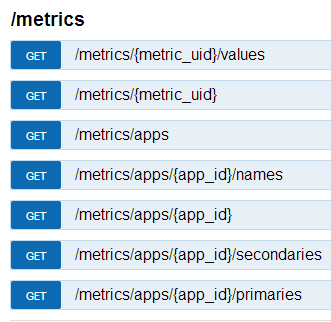
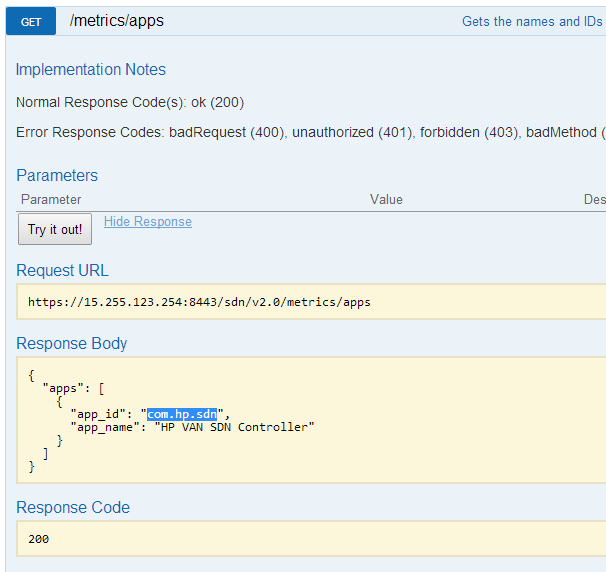
Displaying the application IDs
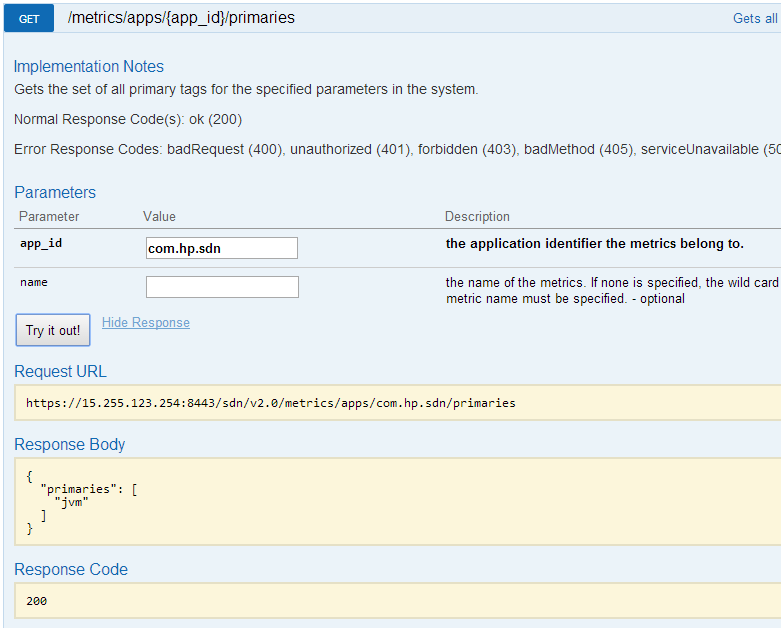
The metrics/apps command will display the application IDs for applications – including the controller itself – that have persisted metrics to disk. In this example, only the base controller itself has persisted metrics to disk.
All metrics available
The following command lists all of the metrics available for a specific application (the controller itself in this example); because of the number of metrics available the output is cut off.
NOTE: This output describes the metrics; it does not represent the time‐series values for them. | |
Curl equivalent command
curl ‐‐noproxy <controller_ip> ‐X GET ‐‐header "X‐Auth‐Token:<token>" ‐‐fail ‐ksSfL ‐‐url "https://<controller_ip>:8443/sdn/v2.0/metrics/apps/<app_id>"Curl output for <app_id>=com.hp.sdn
{"metrics":[{"app_id":"com.hp.sdn","type":"RATIO_GAUGE","name":"cpuLoadSystem","description":
"The recent CPU usage of the system.","primary_tag":"jvm","secondary_tag":
"operatingSystem","jmx":false,"persistence":true,"summary_interval":
"ONE","uid":"42f65cd8-03c3-4cad-9788-012d513e3c0f"},{"app_id":
"com.hp.sdn","type":"GAUGE","name":"committedBytes","description":
"The amount of non-heap memory in bytes that is committed (guaranteed) for the JVM to use.","primary_tag":
"jvm","secondary_tag":"memoryNonHeap","jmx":false,"persistence":
true,"summary_interval":"ONE","uid":"b82f5b00-0373-4a23-b5a8-bbda7eec44cb"},{"app_id":
"com.hp.sdn","type":"GAUGE","name":"countTerminated","description":
"Number of JVM threads that had exited.","primary_tag":"jvm","secondary_tag":
"threads","jmx":false,"persistence":true,"summary_interval":
"ONE","uid":"0e9fe62e-01fd-42e9-88a6-f92021a5e786"},{"app_id":
"com.hp.sdn","type":"GAUGE","name":"uptimeMs","description":
"The uptime of the JVM in milliseconds.","primary_tag":"jvm","jmx":
false,"persistence":true,"summary_interval":"ONE","uid":
"93920384-c0e4-4b4c-987e-79a690a541af"},{"app_id":"com.hp.sdn","type":
"GAUGE","name":"committedBytes","description":
"The amount of heap memory in bytes that is committed (guaranteed) for the JVM to use.","primary_tag":
"jvm","secondary_tag":"memoryHeap","jmx":false,"persistence":
true,"summary_interval":"ONE","uid":"4cb1a4be-3a8d-4f69-a626-2c5ae134c7e3"},{"app_id":"com.hp.sdn","type":
"GAUGE","name":"usedBytes","description":
"The total amount of memory currently being used by the JVM in bytes.","primary_tag":
"jvm","secondary_tag":"memoryTotal","jmx":false,"persistence":true,"summary_interval":
"ONE","uid":"fe56c3fd-9994-4ec4-af59-121357359d58"},{"app_id":"com.hp.sdn","type":
"GAUGE","name":"usedBytes","description":"The amount of heap memory currently being used by the JVM in bytes.",
"primary_tag":"jvm","secondary_tag":"memoryHeap","jmx":false,"persistence":
true,"summary_interval":"ONE","uid":"431b746e-e62e-4874-a801-b1438eaac635"},{"app_id":"com.hp.sdn","type":
"GAUGE","name":"usedBytes","description":"The amount of non-heap memory currently being used by the JVM in bytes.",
"primary_tag":"jvm","secondary_tag":"memoryNonHeap","jmx":false,"persistence":true,"summary_interval":"ONE","uid":
"afa9a4b2-856a-4f69-8abf-a4775fd0f2e7"},{"app_id":"com.hp.sdn","type":"ROLLING_COUNTER","name":"count","description":
"The number of garbage collections undertaken by the JVM during the sampling interval.","primary_tag":
"jvm","secondary_tag":"garbageCollection","jmx":false,"persistence":
true,"summary_interval":"ONE","uid":"d62c49d4-46b3-4c2c-be60-24f6fa6c6bf6"},{"app_id":
"com.hp.sdn","type":"RATIO_GAUGE","name":"usage","description":
"The ratio of non-heap memory currently being used by the JVM to maximum non-heap memory
requested by the JVM.","primary_tag":"jvm","secondary_tag":"memoryNonHeap","jmx":
false,"persistence":true,"summary_interval":"ONE","uid":"fafefbb9-e953-492e-9ddf-db76961f8958"},
{"app_id":"com.hp.sdn","type":"RATIO_GAUGE","name":"averageBufferUsedBytes","description":
"The average bytes used in each mapped memory buffer associated with the JVM.","primary_tag":
"jvm","secondary_tag":"nioMappedMemory","jmx":false,"persistence":true,"summary_interval":
"ONE","uid":"25a38f14-1ea3-4bc8-9588-fe4c53a587dd"},{"app_id":"com.hp.sdn","type":"GAUGE","name":
"bufferUsedBytes","description":"The total amount of mapped buffer memory that the JVM is using in bytes.",
"primary_tag":"jvm","secondary_tag":"nioMappedMemory","jmx":false,"persistence":true,"summary_interval":
"ONE","uid":"c715e388-87dc-4f05-a430-c3c39e73615e"},{"app_id":"com.hp.sdn","type":"GAUGE","name":
"bufferUsedBytes","description":"The total amount of direct buffer memory that the JVM is using in bytes.",
"primary_tag":"jvm","secondary_tag":"nioDirectMemory","jmx":false,"persistence":true,"summary_interval":
"ONE","uid":"f7301f57-e013-477c-af8f-cf3dae376232"},{"app_id":"com.hp.sdn","type":"GAUGE","name":
"bufferCapacityBytes","description":"The total capacity in bytes of direct buffer memory associated with the JVM.",
"primary_tag":"jvm","secondary_tag":"nioDirectMemory","jmx":false,"persistence":true,"summary_interval":
"ONE","uid":"fbcebed0-21a2-4b8a-8e68-0351cddefee8"},{"app_id":"com.hp.sdn","type":"RATIO_GAUGE","name":
"averageBufferCapacityBytes","description":"The average capacity in bytes of each mapped memory buffer
associated with the JVM.","primary_tag":"jvm","secondary_tag":"nioMappedMemory","jmx":
false,"persistence":true,"summary_interval":"ONE","uid":"42aee5ea-934d-4816-a1fd-f2f8f99e5160"},
{"app_id":"com.hp.sdn","type":"GAUGE","name":"countRunnable","description":
"Number of JVM threads that were executing.","primary_tag":"jvm","secondary_tag":
"threads","jmx":false,"persistence":true,"summary_interval":"ONE","uid":
"b3acc121-e892-4759-90c5-63969b0fcfb7"},{"app_id":"com.hp.sdn","type":
"GAUGE","name":"countTimedWaiting","description":"Number of JVM threads
waiting up to a specified period for another thread to perform a particular action.",
"primary_tag":"jvm","secondary_tag":"threads","jmx":false,"persistence":
true,"summary_interval":"ONE","uid":"9c6928b5-9ca3-4e9b-956f-177625ea2b8a"},
{"app_id":"com.hp.sdn","type":"RATIO_GAUGE","name":"fileDescriptorsUsage",
"description":"The ratio of file descriptors open on the operating system to
the maximum supported file descriptors.","primary_tag":"jvm","secondary_tag":
"operatingSystem","jmx":false,"persistence":true,"summary_interval":"ONE","uid":
"466e03fa-a9b7-4ba5-b7cd-d697dba9b1be"},{"app_id":"com.hp.sdn","type":
"RATIO_GAUGE","name":"averageBufferCapacityBytes","description":
"The average capacity in bytes of each direct memory buffer associated with the JVM.",
"primary_tag":"jvm","secondary_tag":"nioDirectMemory","jmx":false,"persistence":
true,"summary_interval":"ONE","uid":"393bc882-0fc4-4eea-9aaa-97acd716a0c5"},{"app_id":
"com.hp.sdn","type":"GAUGE","name":"countBlocked","description":
"Number of JVM threads that were blocked.","primary_tag":"jvm","secondary_tag":
"threads","jmx":false,"persistence":true,"summary_interval":"ONE","uid":
"f0be8e6d-a456-4b8c-83cb-d156629b9aec"},{"app_id":"com.hp.sdn","type":
"ROLLING_COUNTER","name":"elapsedMs","description":"The number of milliseconds
for which garbage collection was undertaken by the JVM during the sampling interval.",
"primary_tag":"jvm","secondary_tag":"garbageCollection","jmx":false,"persistence":
true,"summary_interval":"ONE","uid":"b550925d-c8d9-4396-a3ab-ec37d498fd8f"},{"app_id":
"com.hp.sdn","type":"GAUGE","name":"countDeadlocked","description":
"Number of JVM threads that were in deadlock.","primary_tag":"jvm","secondary_tag":
"threads","jmx":false,"persistence":true,"summary_interval":"ONE","uid":
"505b577c-8606-4172-92d5-90b26ac2be85"},{"app_id":"com.hp.sdn","type":
"GAUGE","name":"countWaiting","description":"Number of JVM threads waiting
indefinitely for another thread to perform a particular action.","primary_tag":
"jvm","secondary_tag":"threads","jmx":false,"persistence":true,"summary_interval":
"ONE","uid":"cb00d09b-1d9c-4f96-a5c9-8a6cd06ad5bd"},{"app_id":"com.hp.sdn","type":
"GAUGE","name":"bufferCount","description":"The number of direct memory buffers
associated with the JVM.","primary_tag":"jvm","secondary_tag":"nioDirectMemory","jmx":
false,"persistence":true,"summary_interval":"ONE","uid":"cdcbb352-d001-4be0-a7fd-c6d614c75f1a"},
{"app_id":"com.hp.sdn","type":"GAUGE","name":"countNew","description":
"Number of JVM threads that had not yet started.","primary_tag":"jvm","secondary_tag":
"threads","jmx":false,"persistence":true,"summary_interval":"ONE","uid":
"0e67f839-48b6-4270-9d83-ac7828c742f6"},{"app_id":"com.hp.sdn","type":
"GAUGE","name":"countDaemon","description":"Number of JVM threads that were live
daemon threads.","primary_tag":"jvm","secondary_tag":"threads","jmx":
false,"persistence":true,"summary_interval":"ONE","uid":"7328dd03-57fd-4baa-b741-25dab77446fc"},
{"app_id":"com.hp.sdn","type":"RATIO_GAUGE","name":"cpuLoadJvm","description":
"The recent CPU usage of the JVM process.","primary_tag":"jvm","secondary_tag":
"operatingSystem","jmx":false,"persistence":true,"summary_interval":"ONE","uid":
"cc82ee87-80eb-417b-8d41-9010fbf24b63"},{"app_id":"com.hp.sdn","type":"GAUGE","name":
"bufferCapacityBytes","description":"The total capacity in bytes of mapped buffer
memory associated with the JVM.","primary_tag":"jvm","secondary_tag":"nioMappedMemory"
,"jmx":false,"persistence":true,"summary_interval":"ONE","uid":"6c08d248-e6dd-4d96-b3de-9ee6c32825d3"},
{"app_id":"com.hp.sdn","type":"RATIO_GAUGE","name":"usage","description":
"The ratio of heap memory currently being used by the JVM to maximum heap memory
requested by the JVM.","primary_tag":"jvm","secondary_tag":"memoryHeap","jmx":
false,"persistence":true,"summary_interval":"ONE","uid":"bc729aec-4bc4-453e-8e9b-6c2fff5eeaef"},
{"app_id":"com.hp.sdn","type":"RATIO_GAUGE","name":"averageBufferUsedBytes","description":
"The average bytes used in each direct memory buffer associated with the JVM.","primary_tag":
"jvm","secondary_tag":"nioDirectMemory","jmx":false,"persistence":true,"summary_interval":
"ONE","uid":"0cac91dd-4f53-4002-8333-d2a104362bd3"},{"app_id":"com.hp.sdn","type":"GAUGE","name":
"fileDescriptorsOpen","description":"The number of file descriptors open on the operating system.",
"primary_tag":"jvm","secondary_tag":"operatingSystem","jmx":false,"persistence":true,
"summary_interval":"ONE","uid":"60bcbb25-7689-484b-bbc9-b403a1ce9b56"},{"app_id":
"com.hp.sdn","type":"GAUGE","name":"countTotal","description":"Total (daemon and non-daemon)
number of live JVM threads.","primary_tag":"jvm","secondary_tag":"threads","jmx":
false,"persistence":true,"summary_interval":"ONE","uid":"fc9d9166-f525-4b7a-93a7-903278075f31"},
{"app_id":"com.hp.sdn","type":"GAUGE","name":"bufferCount","description":
"The number of mapped memory buffers associated with the JVM.","primary_tag":
"jvm","secondary_tag":"nioMappedMemory","jmx":false,"persistence":true,"summary_interval":
"ONE","uid":"dbe9e2fc-f5a5-42d7-a4e9-45bb6c5d0d8d"},{"app_id":"com.hp.sdn","type":
"GAUGE","name":"countNonDaemon","description":"Number of JVM threads that were live non-daemon
threads.","primary_tag":"jvm","secondary_tag":"threads","jmx":false,"persistence":
true,"summary_interval":"ONE","uid":"e13bce02-45f0-47e3-b38e-284d30bc84af"},{"app_id":
"com.hp.sdn","type":"GAUGE","name":"committedBytes","description":
"The total amount of memory in bytes that is committed (guaranteed) for the JVM to use.",
"primary_tag":"jvm","secondary_tag":"memoryTotal","jmx":false,"persistence":
true,"summary_interval":"ONE","uid":"8c6e1603-46a8-4cbb-a2e5-225372d2e36a"}]}
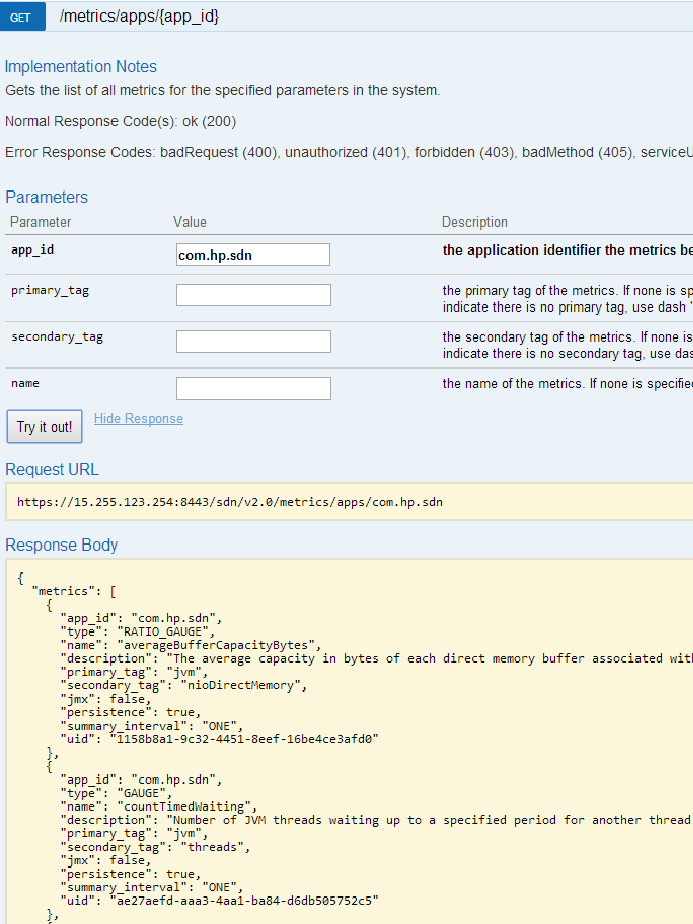 |
Result
For each metric listed, one can see the its type, its associated application ID, its name, its primary and secondary tags, whether it is persisted, whether it is exposed via JMX, and its summary interval. Also displayed for each metric is the unique ID (uid) assigned to the metric on the controller. Other metric REST API calls can be used to view specific subsets of this data.
Secondary tags associated with a specific application
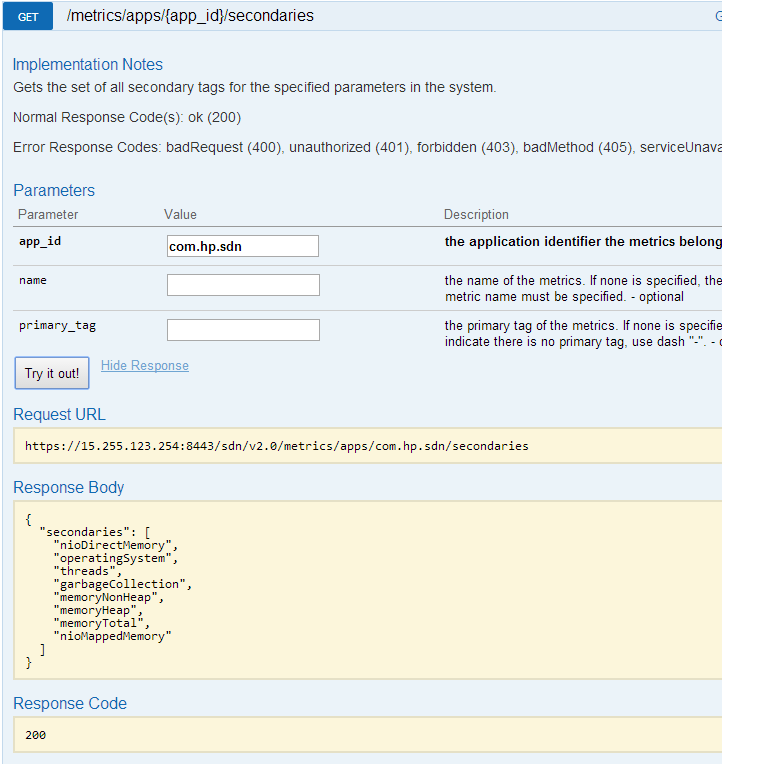
The secondary tags associated with a specific application are listed using the following REST call.
Curl output for app_id=com.hp.sdn
{"secondaries":["nioDirectMemory","operatingSystem","threads","garbageCollection",
"memoryNonHeap","memoryHeap","memoryTotal","nioMappedMemory"]}
Result
Several secondary tags are associated with the primary tag “jvm” along with several subcategories of “jvm” metric: “memoryHeap” metrics and “threads” metrics among others.
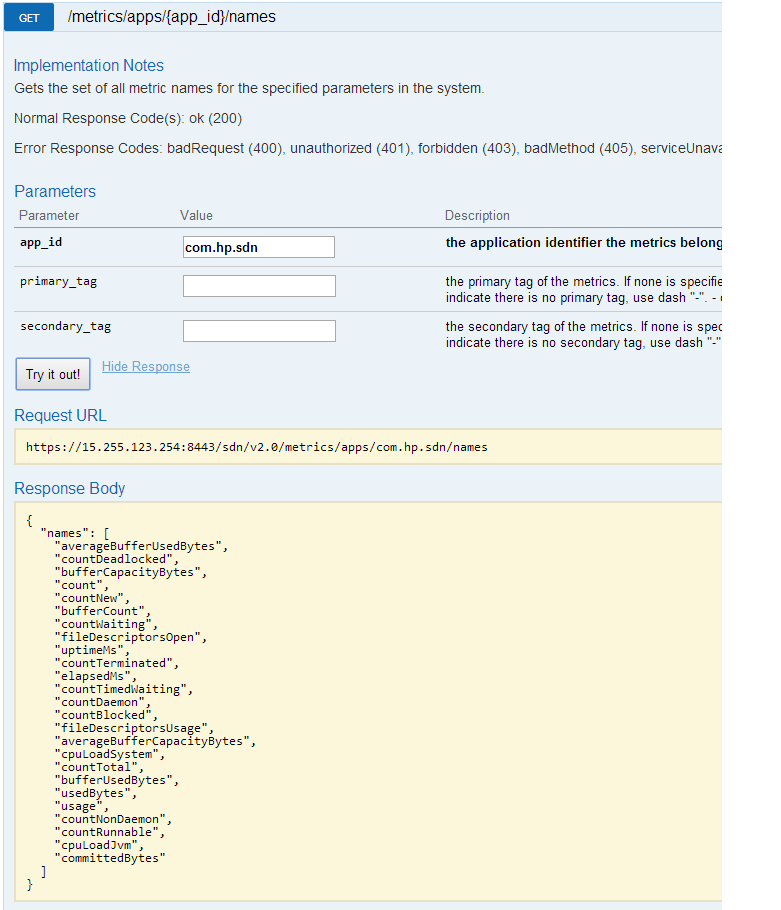
Metric names associated with a specific application
Metric names associated with a specific application are displayed using the following call.
Curl output for app_id=com.hp.sdn
{"names":["averageBufferUsedBytes","countDeadlocked","bufferCapacityBytes","count",
"countNew","bufferCount","countWaiting","fileDescriptorsOpen","uptimeMs","cou ntTerminated",
"elapsedMs","countTimedWaiting","countDaemon","countBlocked","fileDescriptorsUsage",
"averageBuff erCapacityBytes","cpuLoadSystem","countTotal","bufferUsedBytes","usedBytes",
"usage","countNonDaemon","countRu nnable","cpuLoadJvm","committedBytes"]}
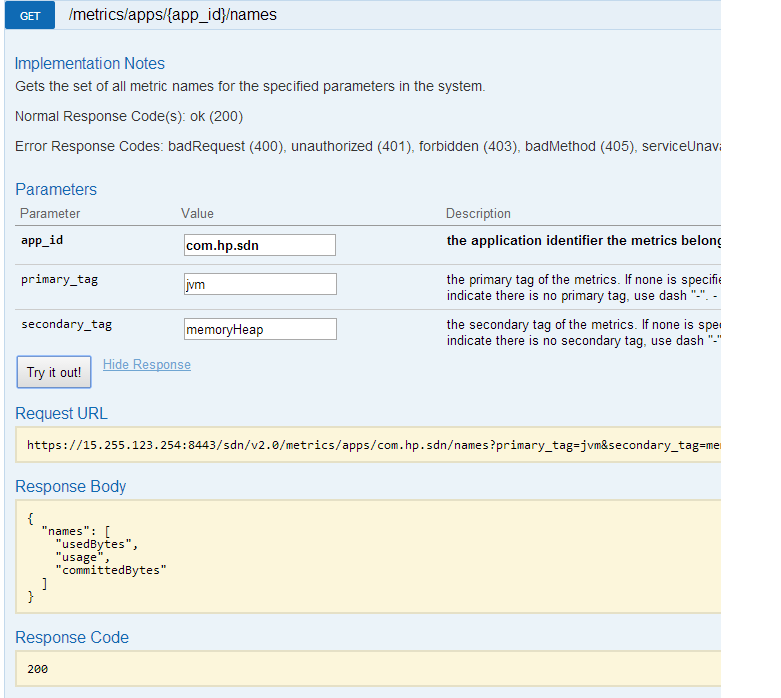
Primary and secondary tags
Curl output for app_id=com.hp.sdn
primary_tag=jvm&secondary_tag=memoryHeap):
 {"names":["usedBytes","usage","committedBytes"]}
Result
Metric names are specific to JVM heap memory. The UID can be obtained once the specific metric of interest is identified via the earlier call. Optional query parameters to filter the output and list the metrics associated with an application ID may be employed.
Filter primary, secondary and metric name
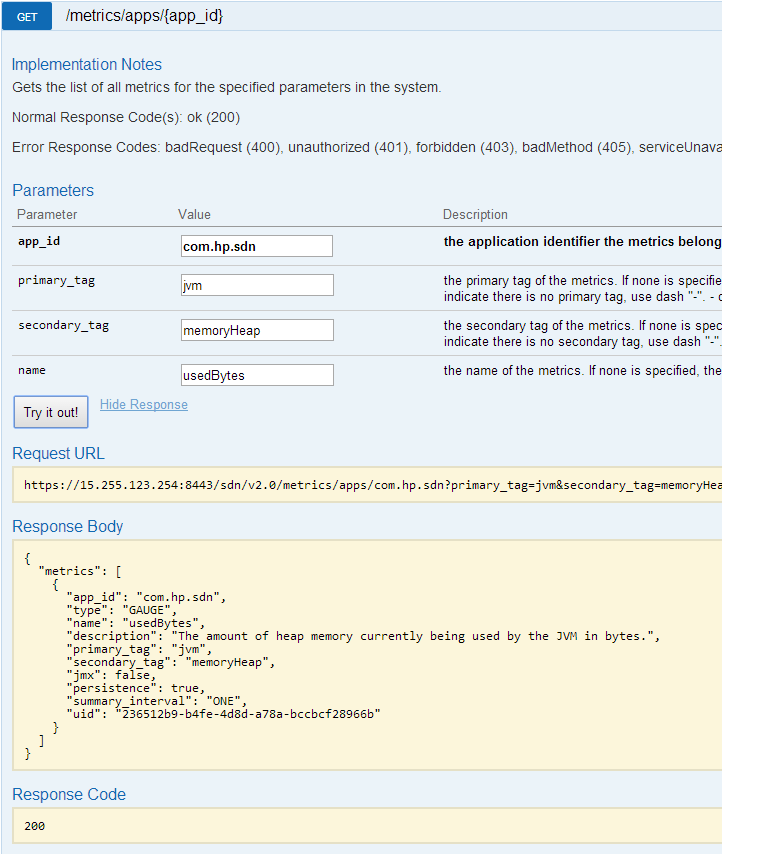
Filter for a primary tag of “jvm”, a secondary tag of “memoryHeap”, and a metric name of “usedBytes”.
Curl equivalent command
curl ‐‐noproxy <controller_ip> ‐X GET ‐‐header "X‐Auth‐Token:<token> ‐‐fail ‐ksSfL ‐ url"https://<controller_ip>:8443/sdn/v2.0/metrics/apps/<app_id>?primary_tag=jvm&secondary_tag=memoryHeap&name=usedBytes”Curl output for app_id=com.hp.sdn, primary_tag=jvm, secondary_tag=memoryHeap, name=usedBytes
{"metrics":[{"app_id":"com.hp.sdn","type":"GAUGE","name":"usedBytes","description":
"The amount of heap memory currently being used by the JVM in bytes.","primary_tag":
"jvm","secondary_tag":"memoryHeap","jmx":false,"persistence":true,"summary_interval":
"ONE","uid":"431b746e‐e62e‐4874‐a801‐b1438eaac635"}]}
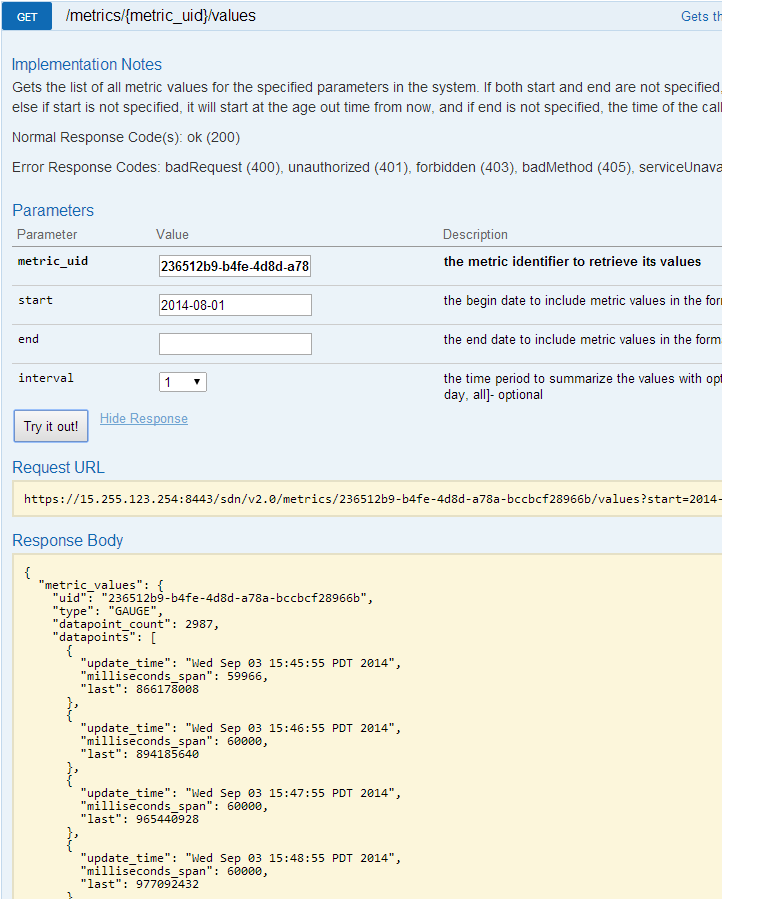
Time‐series data for a metric
The following example shows time‐series data for a metric. The time for which the actual metric value was accrued is shown in each 18 interval in number of milliseconds spanned. The “ast” value is the metric value for the indicated time, spanning the indicated number of milliseconds ending at that time.
Curl equivalent command
curl ‐‐noproxy <controller_ip> ‐X GET ‐‐header "X‐Auth‐Token:<token> ‐‐fail ‐ksSfL ‐‐ url"https://<controller_ip>:8443/sdn/v2.0/metrics/<metric_uid>/values?start=<start>&interval=<interval>”Curl output for app_id=com.hp.sdn, metric_uid=431b746e‐e62e‐4874‐a801‐b1438eaac635,<start>=2014‐09‐23+18:00,<interval>=1
{"metric_values":{"uid":"431b746e-e62e-4874-a801-b1438eaac635","type":"GAUGE","datapoint_count":
25,"datapoints":[{"update_time":"Tue Sep 23 17:59:55 PDT 2014","milliseconds_span":60000,"last":
3.22526704E8},{"update_time":"Tue Sep 23 18:00:55 PDT 2014","milliseconds_span":60000,"last":
3.24059976E8},{"update_time":"Tue Sep 23 18:01:55 PDT 2014","milliseconds_span":60001,"last":
3.28183496E8},{"update_time":"Tue Sep 23 18:02:55 PDT 2014","milliseconds_span":60000,"last":
3.28906008E8},{"update_time":"Tue Sep 23 18:03:55 PDT 2014","milliseconds_span":59999,"last":
3.333726E8},{"update_time":"Tue Sep 23 18:04:55 PDT 2014","milliseconds_span":60001,"last":
3.3423956E8},{"update_time":"Tue Sep 23 18:05:55 PDT 2014","milliseconds_span":59999,"last":
3.39215208E8},{"update_time":"Tue Sep 23 18:06:55 PDT 2014","milliseconds_span":60001,"last":
3.40427184E8},{"update_time":"Tue Sep 23 18:07:55 PDT 2014","milliseconds_span":60000,"last":
3.44840904E8},{"update_time":"Tue Sep 23 18:08:55 PDT 2014","milliseconds_span":59999,"last":
2.0824068E8},{"update_time":"Tue Sep 23 18:09:55 PDT 2014","milliseconds_span":60000,"last":
2.09534728E8},{"update_time":"Tue Sep 23 18:10:55 PDT 2014","milliseconds_span":60000,"last":
2.13733336E8},{"update_time":"Tue Sep 23 18:11:55 PDT 2014","milliseconds_span":60000,"last":
2.15092288E8},{"update_time":"Tue Sep 23 18:12:55 PDT 2014","milliseconds_span":60000,"last":
2.18786248E8},{"update_time":"Tue Sep 23 18:13:55 PDT 2014","milliseconds_span":60000,"last":
2.20134712E8},{"update_time":"Tue Sep 23 18:14:55 PDT 2014","milliseconds_span":60000,"last":
3.73961104E8},{"update_time":"Tue Sep 23 18:15:55 PDT 2014","milliseconds_span":60000,"last":
4.2576752E8},{"update_time":"Tue Sep 23 18:16:55 PDT 2014","milliseconds_span":60000,"last":
4.28963472E8},{"update_time":"Tue Sep 23 18:17:55 PDT 2014","milliseconds_span":60000,"last":
4.32102736E8},{"update_time":"Tue Sep 23 18:18:55 PDT 2014","milliseconds_span":60000,"last":
4.35269584E8},{"update_time":"Tue Sep 23 18:19:55 PDT 2014","milliseconds_span":60000,"last":
4.40140248E8},{"update_time":"Tue Sep 23 18:20:55 PDT 2014","milliseconds_span":60001,"last":
4.47377528E8},{"update_time":"Tue Sep 23 18:21:55 PDT 2014","milliseconds_span":59999,"last":
4.50576336E8},{"update_time":"Tue Sep 23 18:22:55 PDT 2014","milliseconds_span":60001,"last":
2.19738976E8},{"update_time":"Tue Sep 23 18:23:55 PDT 2014","milliseconds_span":59999,"last":3.7457348E8}]}}
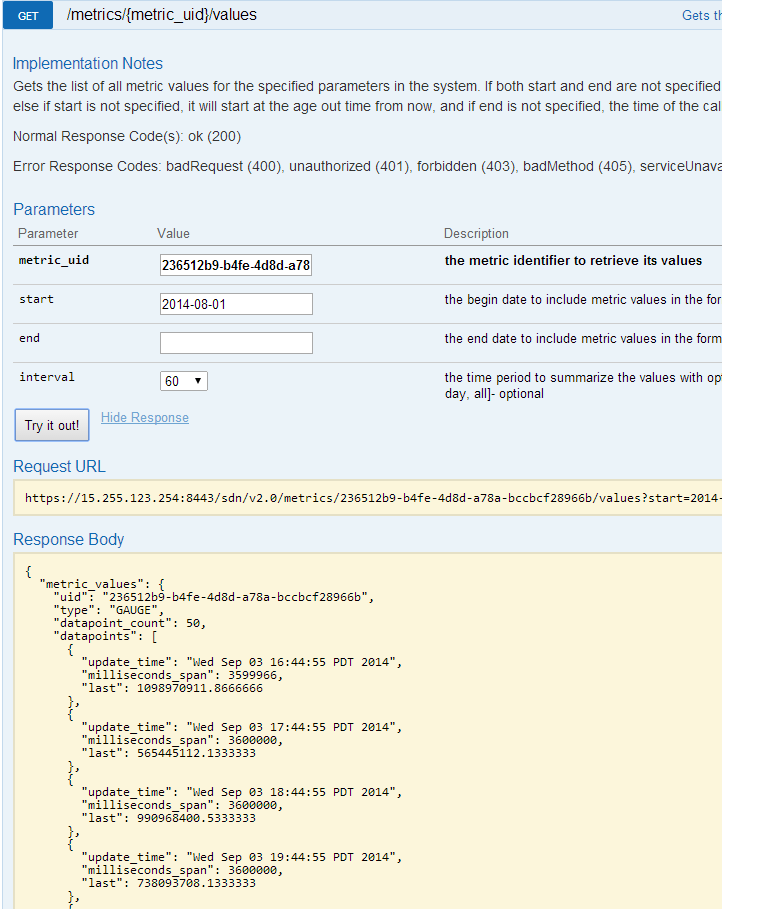
Returned data for a period results
Summarizing the returned data for a period results in (generally) larger values for the metrics themselves and larger values for the milliseconds spanned.
Curl equivalent command
curl ‐‐noproxy <controller_ip> ‐X GET ‐‐header "X‐Auth‐Token:<token> ‐‐fail ‐ksSfL ‐‐ url"https://<controller_ip>:8443/sdn/v2.0/metrics/<metric_uid>/values?start=<start>&interval=<interval>”Curl output for app_id=com.hp.sdn, metric_uid=431b746e‐e62e‐4874‐a801‐b1438eaac635,<start>=2014‐09‐23+18:00,<interval>=5
{"metric_values":{"uid":"431b746e-e62e-4874-a801-b1438eaac635","type":"GAUGE","datapoint_count":6,"datapoints":
[{"update_time":"Tue Sep 23 18:03:55 PDT 2014","milliseconds_span":300000,"last":3.274097568E8},{"update_time":
"Tue Sep 23 18:08:55 PDT 2014","milliseconds_span":300000,"last":3.133927072E8},{"update_time":
"Tue Sep 23 18:13:55 PDT 2014","milliseconds_span":300000,"last":2.154562624E8},{"update_time":
"Tue Sep 23 18:18:55 PDT 2014","milliseconds_span":300000,"last":4.192128832E8},{"update_time":
"Tue Sep 23 18:23:55 PDT 2014","milliseconds_span":300000,"last":3.864813136E8},{"update_time":
"Tue Sep 23 18:27:55 PDT 2014","milliseconds_span":240000,"last":3.847236E8}]}}
Result
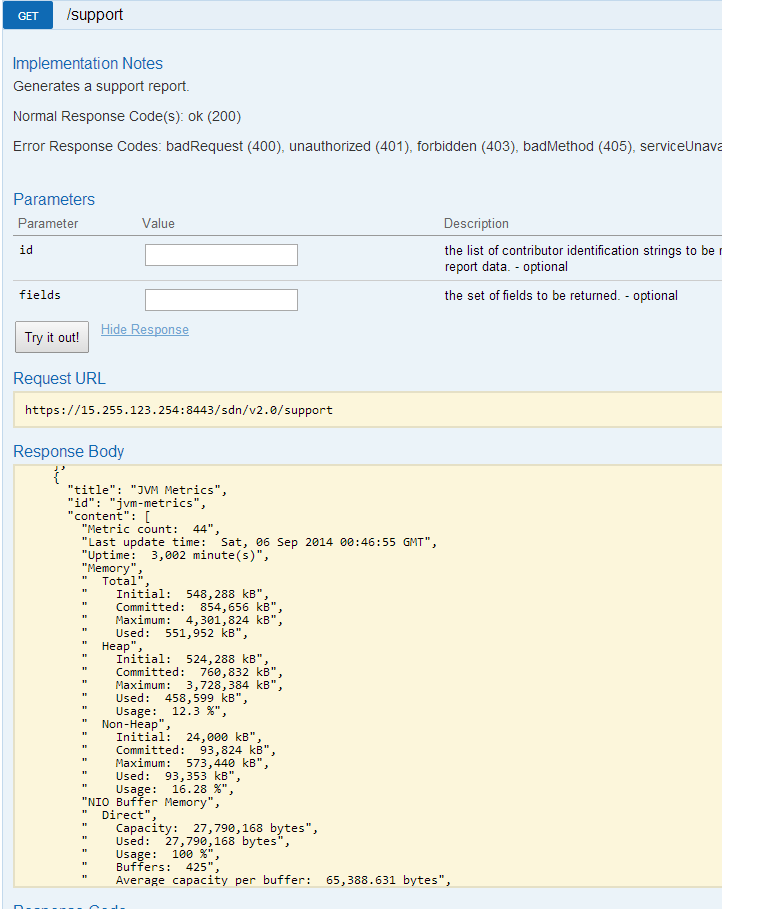
Support report
This report may be generated via the following REST API.
Curl equivalent command
curl ‐‐noproxy <controller_ip> ‐X GET ‐‐header "X‐Auth‐Token:<token> ‐‐fail ‐ksSfL ‐‐url“https://<controller_ip>:8443/sdn/v2.0/support”Curl output <controller_ip>:8443/sdn/v2.0/support
{"support_report":
[{"title":"Alert Framework","id":"alert","content":["Alert-Topics: licensing","Alert-Count:
 7","Data Retention Age Out: 14 days","Data Trim Interval: 24 hours","Data Trim Enabled:
 true","Last trim conducted at: Mon Sep 22 19:15:20 PDT 2014"]},{"title":"Alert Topic Listener",
"id":"alert_listener","content":["No registered alert topic listeners"]},{"title":"App Manager",
"id":"app-management","content":["Installed Applications: 8","Path Diagnostics, Version:
 2.5.0.SNAPSHOT, State: ACTIVE","Link Manager, Version: 2.5.0.SNAPSHOT, State: ACTIVE",
"Node Manager, Version: 2.5.0.SNAPSHOT, State: ACTIVE","OpenFlow Link Discovery, Version:
 2.5.0.SNAPSHOT, State: ACTIVE","OpenFlow Node Discovery, Version: 2.5.0.SNAPSHOT, State:
 ACTIVE","Path Daemon, Version: 2.5.0.SNAPSHOT, State: ACTIVE","Topology Manager, Version:
 2.5.0.SNAPSHOT, State: ACTIVE","Topology Viewer, Version: 2.5.0.SNAPSHOT, State: ACTIVE"]},
{"title":"Audit Log Framework","id":"audit_log","content":["Audit Log Count: 0","Data
Retention Age Out: 365 days","Data Trim Interval: 24 hours","Data Trim Enabled: true",
"Last trim conducted at: Mon Sep 22 19:15:20 PDT 2014"]},{"title":"Server Environment",
"id":"env","content":["OS architecture: amd64","OS Name: Linux","OS Version: 3.5.0-52-generic",
"Java Vendor: Oracle Corporation","Java Version: 24.65-b04","Java Name: OpenJDK 64-Bit
Server VM","Available processors (cores): 4","Max Heap: 3817865216  [3641Mb]","Heap:
 671088640  [640Mb]","Heap used: 405144704  [386Mb]","Start Date: Tue Sep 16 19:14:57 PDT
2014","UpTime: 6 Days, 23 Hours","HP VAN SDN Controller Version: 2.5.0.0482"]},{"title":
"JVM Metrics","id":"jvm-metrics","content":["Metric count:  44","Last update time:  Wed, 24
 Sep 2014 01:31:55 GMT","Uptime:  10,037 minute(s)","Memory","  Total","    Initial:
548,288 kB","    Committed:  740,032 kB","    Maximum:  4,301,824 kB","    Used:  477,308 kB",
"  Heap","    Initial:  524,288 kB","    Committed:  655,360 kB","    Maximum:  3,728,384 kB",
"    Used:  393,227 kB","    Usage:  10.547 %","  Non-Heap","    Initial:  24,000 kB",
"    Committed:  84,672 kB","    Maximum:  573,440 kB","    Used:  84,081 kB","    Usage:
  14.663 %","NIO Buffer Memory","  Direct","    Capacity:  0 bytes","    Used:  0 bytes",
"    Buffers:  0","  Mapped","    Capacity:  0 bytes","    Used:  0 bytes","    Buffers:
  0","Garbage Collection (last 1 minute(s))","  Executions:  0","  Elapsed time:  0 ms",
"Threads","  Total count:  122","  By Type","    Daemon:  65","    Non-daemon:  57",
"  By State","    Blocked:  0","    Deadlocked:  0","    New:  0","    Runnable:  7",
"    Terminated:  0","    Timed waiting:  24","    Waiting:  91","Operating System",
"  CPU Usage","    System:  0.079 %","    JVM:  0.058 %","  File Descriptors","
Maximum:  8,192","    Open:  214","    Usage:  2.612 %"]},{"title":"Licensing","id":
"licensing","content":["Number of licenses Found: None"]}]}