MXDM enables you to view the table statistics. You can use the table statistics to troubleshoot and to create additional indexes. To view table statistics, the default catalog (NONSTOP_SYSTEM_NSK) and the default schema (PUBLIC_ACCESS_SCHEMA) are required. If the default catalog and schema are not available, table statistics are not displayed. For information on creating the default catalog and schema, see
HPE NonStop SQL/MX Connectivity Service Manual for SQL/MX Release 3.4.
To display information related to table statistics:
Procedure
Log on to the MXDM.
In the navigation tree pane, click
Database.
MXDM displays a list of existing systems.
In the navigation tree, expand the contents of the system.
The list of catalogs appears.
Expand the contents of a catalog.
The list of schemas appears.
Expand the contents of a schema.
The
Tables folder appears.
Select a table.
In the right pane, click
Statistics.
The following histogram statistics for the table appear:
Column Name — The name of the column.
Data Type — This attribute specifies the column data type.
# Nulls — The number of null values for the column.
Min Value — The minimum value of the column.
Max Value — The maximum value of the column.
Skew — The CV entry in HISTOGRAMS table for the column.
UEC — The
TOTAL_UEC (Unique Entry Count) entry from HISTOGRAMS table for the column.
Cardinality — The
ROWCOUNT entry from HISTOGRAMS table for the column.
Last Stats Timestamp — The
STATS_TIME from HISTOGRAMS table for the column.
NOTE:
The
Statistics tab includes information only if the table statistics are generated. To generate the table statistics, you must execute the
Update Statistics statement on the table.
For more information on the HISTOGRAMS table, see
HPE NonStop SQL/MX Release 3.4 Reference Manual
.
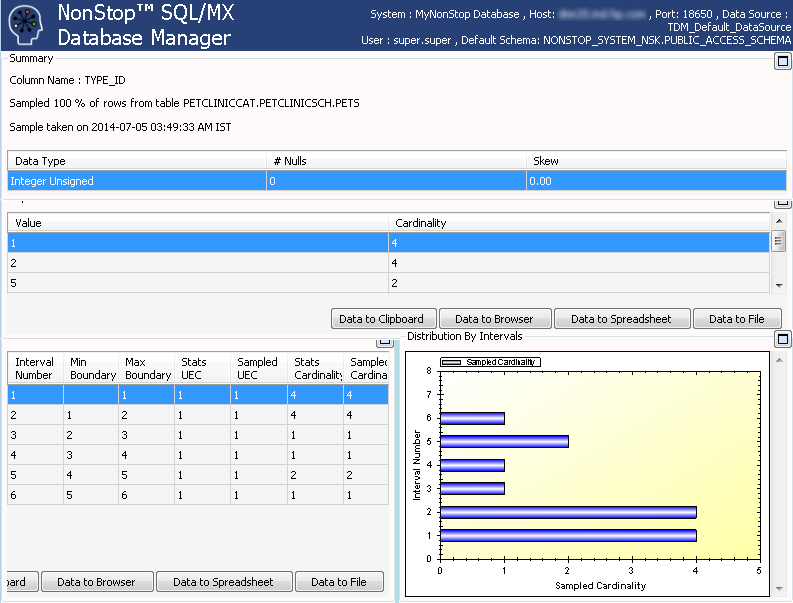
To display a sample view of the table column statistics, click the column name, double-click any row in the right pane, or click
View Sampled Column Statistics located at the top right pane.
The top pane displays the column name, table name, the percentage sampled, and the time when the sample was taken.
The following details appear:
Data Type — Displays the column data type.
# Nulls — The number of null values for the column.
Skew — The CV entry from HISTOGRAMS table for this column.
The middle pane displays the ten most frequent values for the column. The value itself and its cardinality (number of occurrences) appear.
The bottom pane displays the following histogram intervals for the column data boundaries:
Interval Number — The
INTERVAL_NUMBER entry from theHISTOGRAM_INTERVALS table.
Min Boundary — The minimum value for the interval, for the column.
Max Boundary — The maximum value for the interval, for the column.
Stats UEC — The
TOTAL_UEC entry from the HISTOGRAMS table for the column.
Sampled UEC — The
INTERVAL_UEC from the
HISTOGRAM_INTERVALS table.
Stats Cardinality — The
ROWCOUNT from the
HISTOGRAMS table for the column.
Sampled Cardinality — The
INTERVAL_ROWCOUNT from the
HISTOGRAMS_INTERVALS table for this column.
The diagram at the bottom right relates the Sampled Cardinality to the Interval Number from the Intervals table located at the left of the diagram.