Viewing an alert on the graph
The graph shown on the Agent Details page might not show the time period or resource associated with a specific alert. Use this procedure to change the graph to show the alert and the associated metric.
-
From the alerts panel on the Agent Details page, select an alert and click
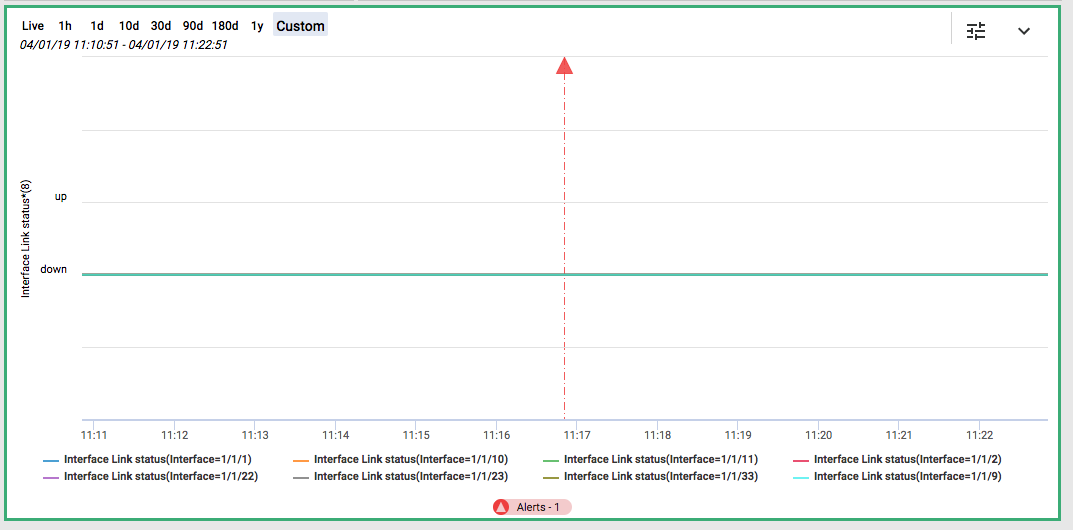
Navigate.
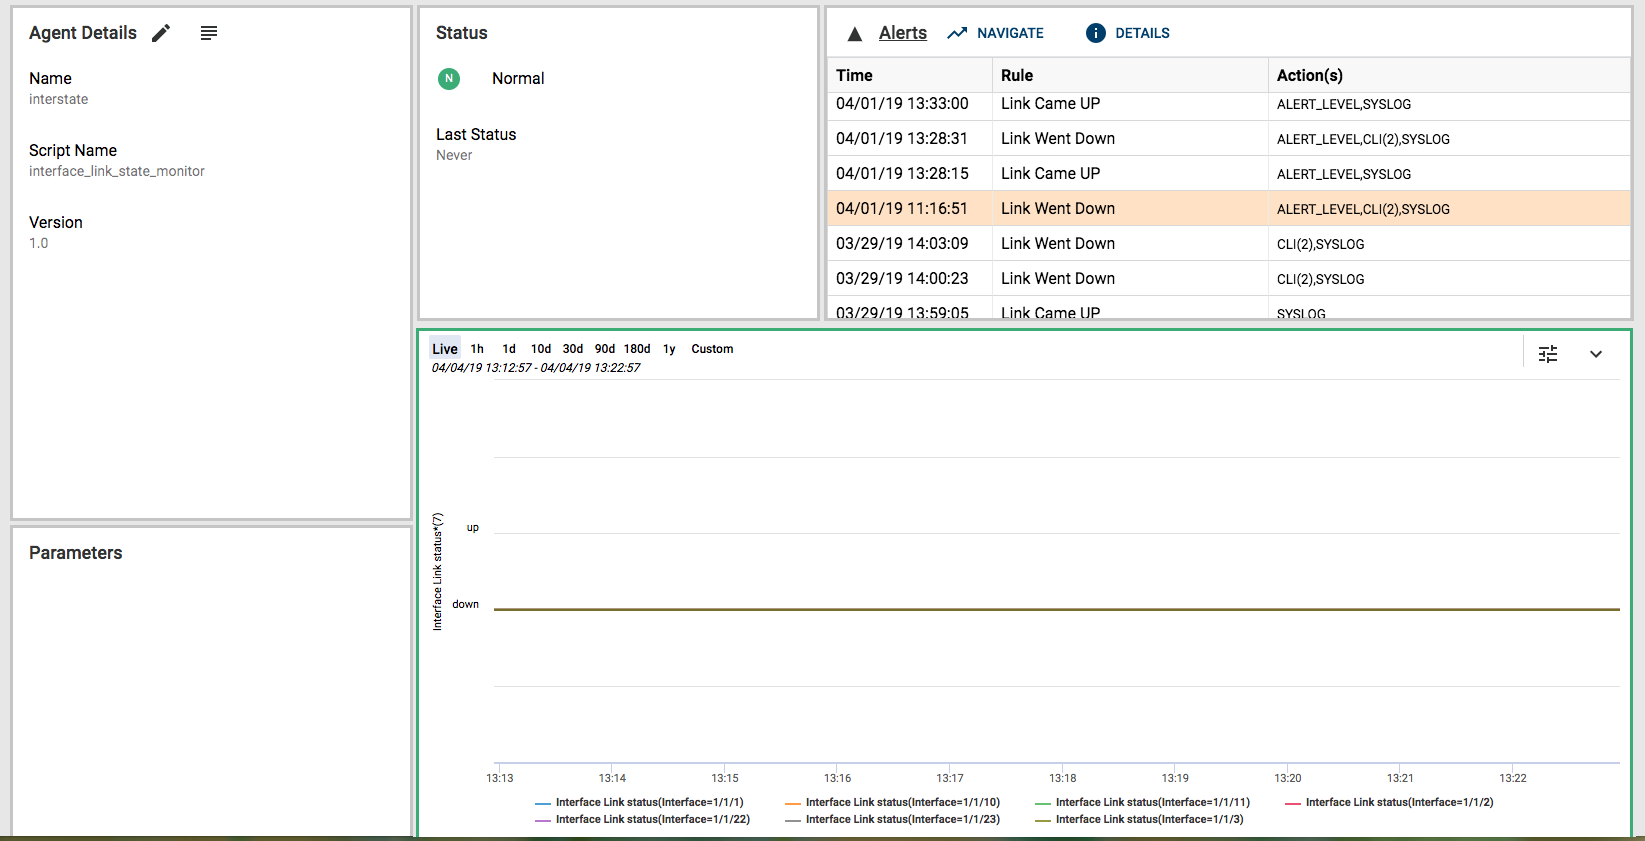
The graph is changed to display the time period containing the alert. However, the alert might be for a metric that is being monitored but that is not being shown in the graph.
The graph displays alerts for all metrics being monitored. However, the graph can show graphed data for a maximum of eight metrics at a time. The metrics that are being shown on the graph are listed at the bottom of the graph.
-
To adjust the graph display to show the metrics for the alert, do the following:
- Locate the alert on the graph and click the alert triangle flag.
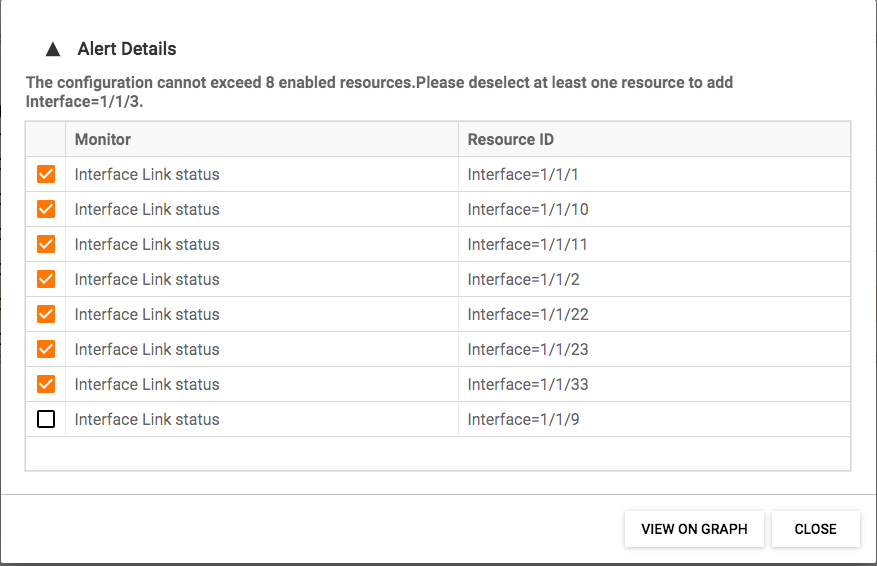
The Alert Details dialog box is displayed.
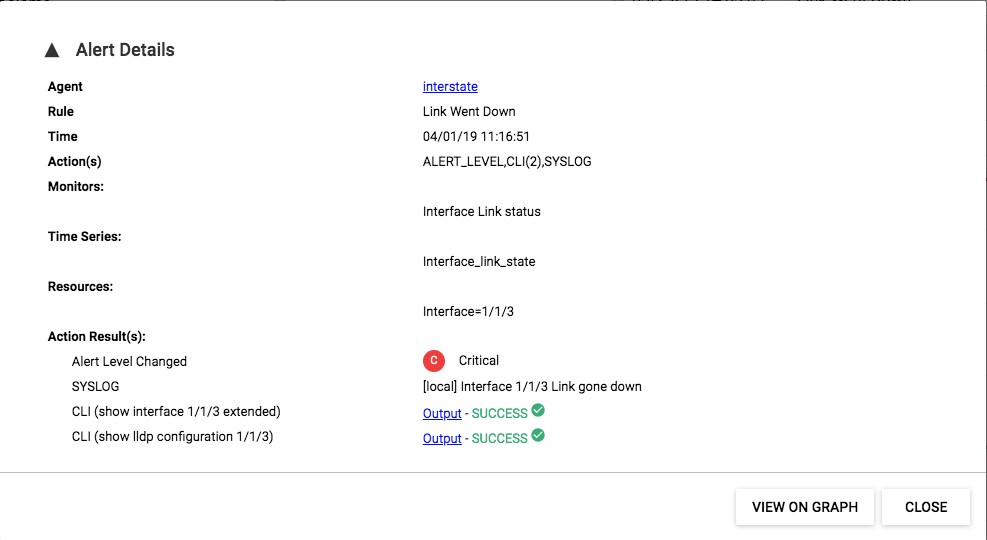
- Locate the alert on the graph and click the alert triangle flag.
-
If the graph is showing eight metrics and the metric you want to display is the ninth metric, you must choose an existing metric to clear so that the graph can show the metric associated with the alert.
For example:
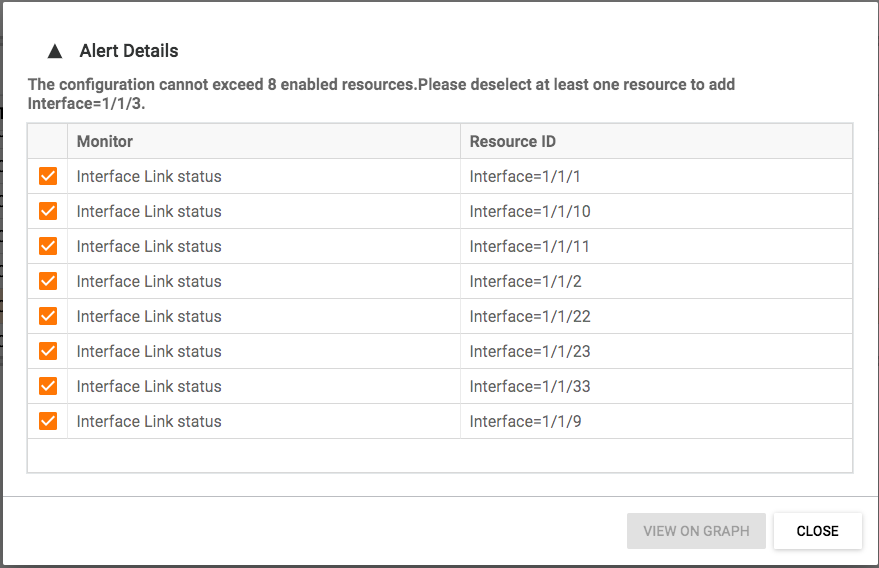
- Clear the selection box for the metrics you no longer want to show.
For example:
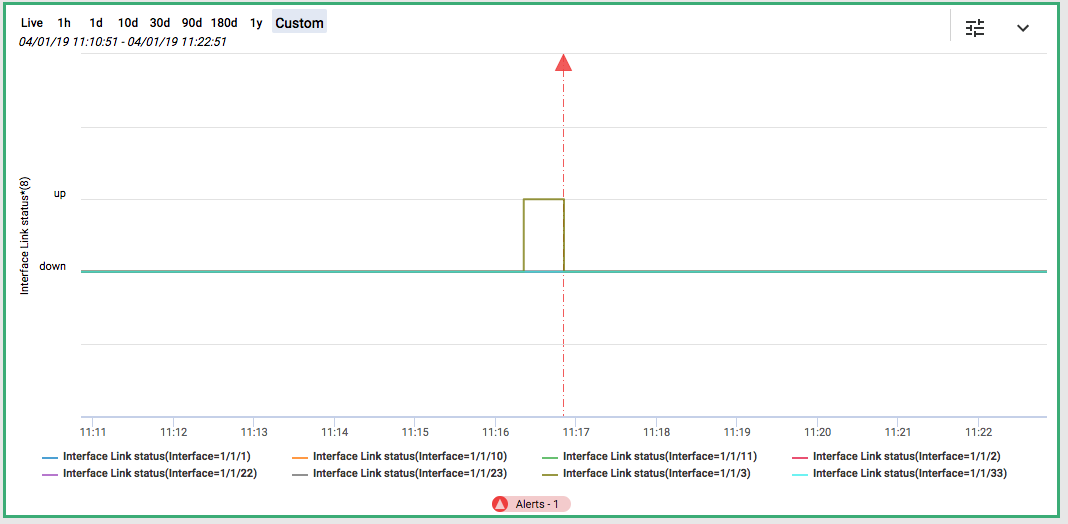
The graph is changed to show the metric associated with the alert.
For example:
- Clear the selection box for the metrics you no longer want to show.