Analytics Dashboard
The Analytics Dashboard shows information related to Network Analytics Engine agents, scripts, alerts, and information generated by these scripts. You can use the Network Analytics Engine to automate data collection so you can quickly troubleshoot problems on a switch.
To see the total number of agents scripts, agents, and monitors (both enabled and disabled) compared to the maximum number supported on the switch, see the Analytics panel on the Overview page.
From the Analytics Dashboard, you can drill down to other Analytics detail pages.
For some basic steps to using Analytics to monitor a switch, see Viewing agent information using the Web UI. For complete information about using the Network Analytics Engine, scripts, and agents, see the Network Analytics Engine Guide.
Ensure that both the switch and the client where Web UI is running are set to use NTP or to a time zone based on UTC time. Otherwise, NAE agent data might be incorrect or missing. For example, if the time on switch is set to 2 hours ahead of the client manually instead of by changing the time zone offset, the agent data is populated according to the new time on switch. If the switch time is set back to match client time later, the Time Series Database does not overwrite the old data. Therefore the client Web UI shows inaccurate data.
If the software detects that the switch time and browser time differs by more than one minute, the Web UI displays the following:
A yellow warning triangle in the top banner of the Analytics Dashboard:

When a user logs into the Web UI, the Web UI displays a warning message with the following title:
Switch Time and Browser Time are not in Sync
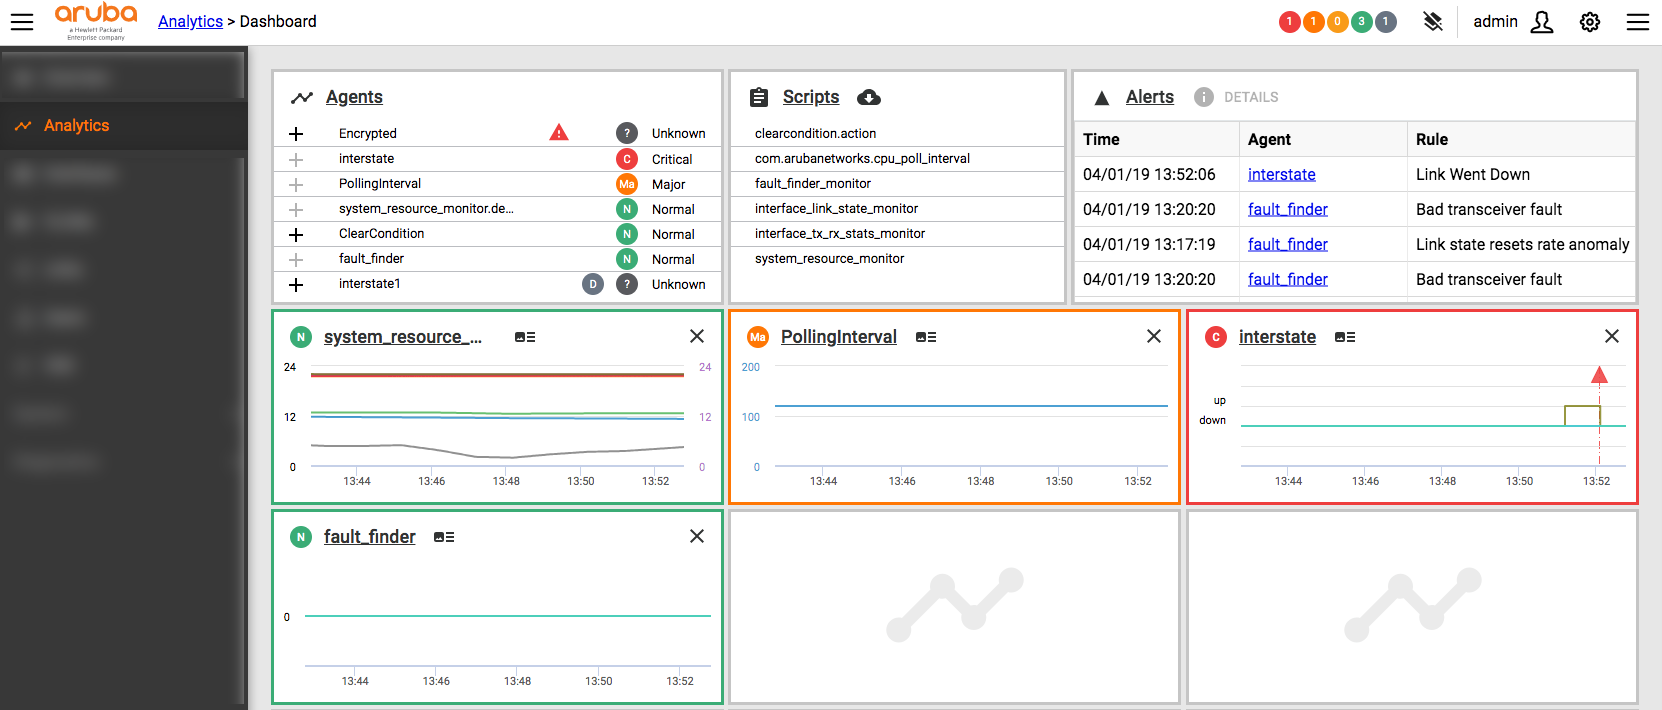
Agents panel
The Agents panel displays a list of agents and agent status (Normal, Minor, Major, Critical and Disabled).
Agents monitor what is specified in the script. You can view agent details like alerts, time series graph of alerts and changes, and parameter information. Agent status (reflecting any alerts or errors) is rolled up to display in the Analytics panel on the Overview page.
Click the Agents link to drill down to the Agents Management page. Click the link to an individual agent in the list to drill down to the Agent Details page.
Scripts panel
The Scripts panel displays a list of scripts.
Scripts specify what the Network Analytics Engine monitors. The script also specifies various conditions and corresponding actions when these conditions are met. Some read-only scripts are provided with the switch. You can create your own scripts or use scripts from other sources such as ones hosted on the Aruba Solutions Exchange (ASE).
Click the Scripts link to drill down to the Scripts Management page. Click the link to an individual script in the list to drill down to the Scripts Details page.
Alerts panel
The Alerts panel displays a list of alerts generated by the agents running on the switch. When a condition is met, an alert is generated.
Select an alert and click the Details button to display a dialog box with more information on the alert. Click the Alerts link to display the Alert History page. Click an agent name to drill down to the Agents Details page.
Analytics time series graph
Optionally, you can add an Analytics agent time series graph to the Analytics Dashboard by clicking the + plus sign next to any agent listed in the Agents panel. If an agent has multiple time series graphs, the graph displayed on the Analytics Dashboard is specified by the script. You cannot choose which graph to display on the Analytics Dashboard, but you can see all the graphs in the Agent Details page. The time series graph shows data collected by the Analytics agent.
Graphs added to the Analytics Dashboard are persistent only in the local browser. If you use a different system or browser, then you would need to customize to add the graphs for that browser instance.
You can remove a graph by clicking X in the panel with the agent time series graph.
Click the link in the graph to drill down to the Agent Details page.