Showing the current and maximum number of agents, monitors, and scripts

Procedure
  • To use the CLI, enter the show capacities-status nae command.

    For example:

    switch# show capacities-status nae
    
    System Capacities Status: Filter NAE
    Capacities Status Name                                           Value Maximum
    ------------------------------------------------------------------------------
    Number of configured NAE agents currently active in the system      1      25
    Number of configured NAE monitors currently active in the system    7      50
    Number of configured NAE scripts currently active in the system     1      12


    For detailed information about the show capacities-status command, see the Command-Line Interface Guide.

  • To use the Web UI, on the Overview page, look at the Analytics panel to see the total number of scripts, agents, and monitors compared to the total number supported on the switch.

    For example, Agents: 6/50 indicates that there are total of six enabled and disabled agents out of a maximum of 50 agents supported on this switch.

    Analytics Panel showing script, agent, and monitor infomation

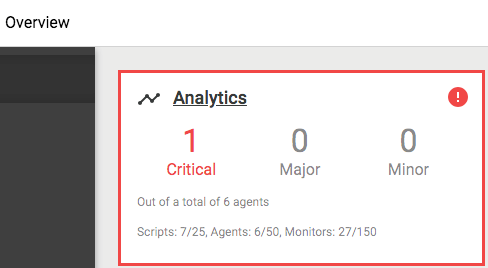
  • To use the REST API, do the following:
    1. To get information about maximum number of scripts, agents, and monitors, send a GET request to the /system resource, specifying the attributes=capacities query parameter. For example:
      GET /rest/v1/system/?attributes=capacities

      The response body contains capacity information about multiple switch features. The information about the Network Analytics Engine starts with the string: nae_

      For example:

      {
        "capacities": {
          ...
          ... 
          "nae_agents": 50,
          "nae_monitors": 150,
          "nae_notification_handlers": 8,
          "nae_notification_queue_size": 25000,
          "nae_notifications_rate": 25000,
          "nae_notifications_rate_per_monoitor": 500,
          "nae_scripts": 25,
          "nae_tsdb_disk_quota": 9,
          ...
          ...
        }
      }
    2. To get information about the current number of scripts, agents, and monitors, send a GET request to the /system resource, specifying the attributes=capacities_status query parameter. For example:
      GET /rest/v1/system/?attributes=capacities_status

      The response body contains information about multiple switch features. The information about the Aruba Network Analytics Engine starts with the string: nae_

      For example:

      {
        "capacities_status": {
          ...
          ... 
          "nae_agents": 6,
          "nae_monitors": 27,
          "nae_scripts": 7,
          ...
          ...
        }
      }