Log page
From the Log page you can view a list of event log entries. Each log entry displayed includes the following: Time, Severity (Critical, Warning, Info), ID, and Message. If you set filtering on the table the custom changes apply only to the data on the current page.
The Log page shows event log messages only. Accounting log messages must be accessed through the REST API or the CLI.
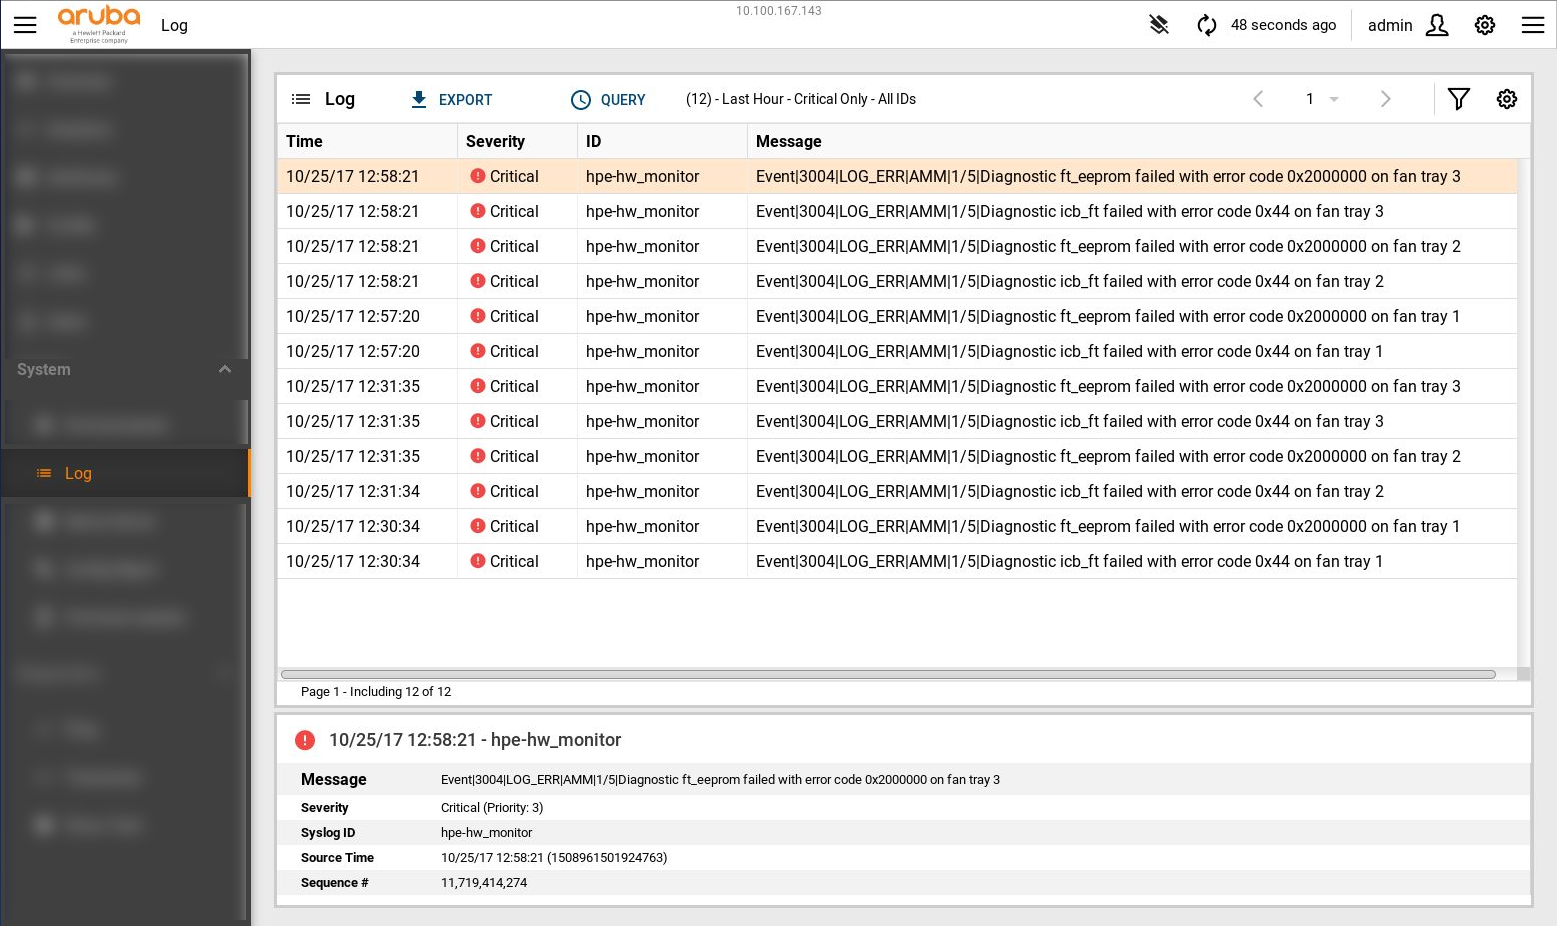
You can select an entry from the list of log entries to view more information in the details pane.
Click Export to download the current log query as a CSV file.
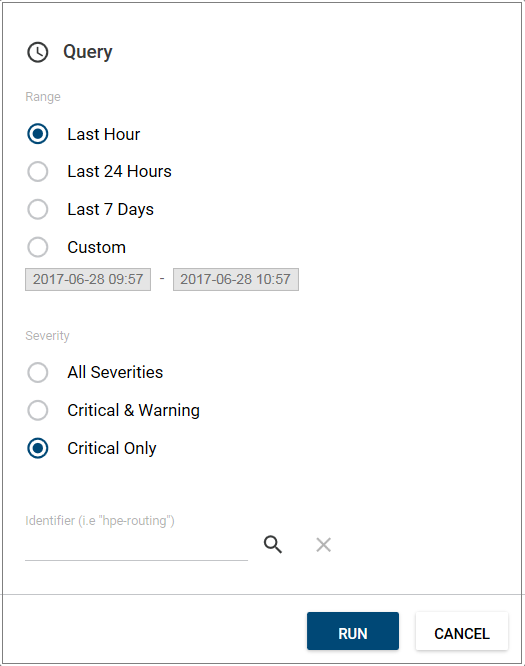
To run a new server-side query, click Query. A Query dialog box is displayed. You can customize the query by Range, Severity, and identifier. Click Run to run the new query.
| Web UI severity | Syslog severity |
|---|---|
| Critical | 0 Emergency: system is unusable 1 Alert: action must be taken immediately 2 Critical: critical conditions 3 Error: error conditions |
| Warning | 4 Warning: warning conditions |
| Info | 5 Notice: normal but significant condition 6 Informational: informational messages 7 Debug: debug-level messages |