Viewing agent information using the Web UI
You can view Analytics agent information including: agent status, script information, agent parameters, one or more time series graphs, and any alerts generated.
You must be logged in to the ArubaOS-CX Web UI.
Ensure that the switch and the client where Web UI is running are set to use NTP or to a time zone based on UTC time. Otherwise, NAE agent data might be incorrect or missing.
For example, if the time on switch is set to 2 hours ahead of the client manually instead of by changing the time zone offset, the agent data is populated according to the new time on switch. If the switch time is set back to match client time later, the Time Series Database does not overwrite the old data. Therefore the client Web UI shows inaccurate data.
-
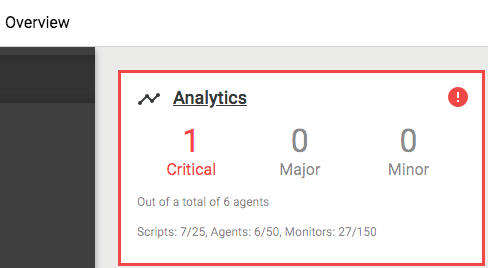
From the Overview page, look at the
Analytics panel to see the total number of agents in critical, major, and minor status.
The Analytics panel also shows the total number of scripts, agents, and monitors compared to the total number supported on the switch. For example,
Agents: 6/50indicates there are total of six enabled and disabled agents out of a maximum of 50 agents supported on this switch.If the panel is outlined in red, it indicates that there are agent status issues.
-
To go to the Analytics Dashboard, select the
Analytics link in the Analytics panel on the Overview page.
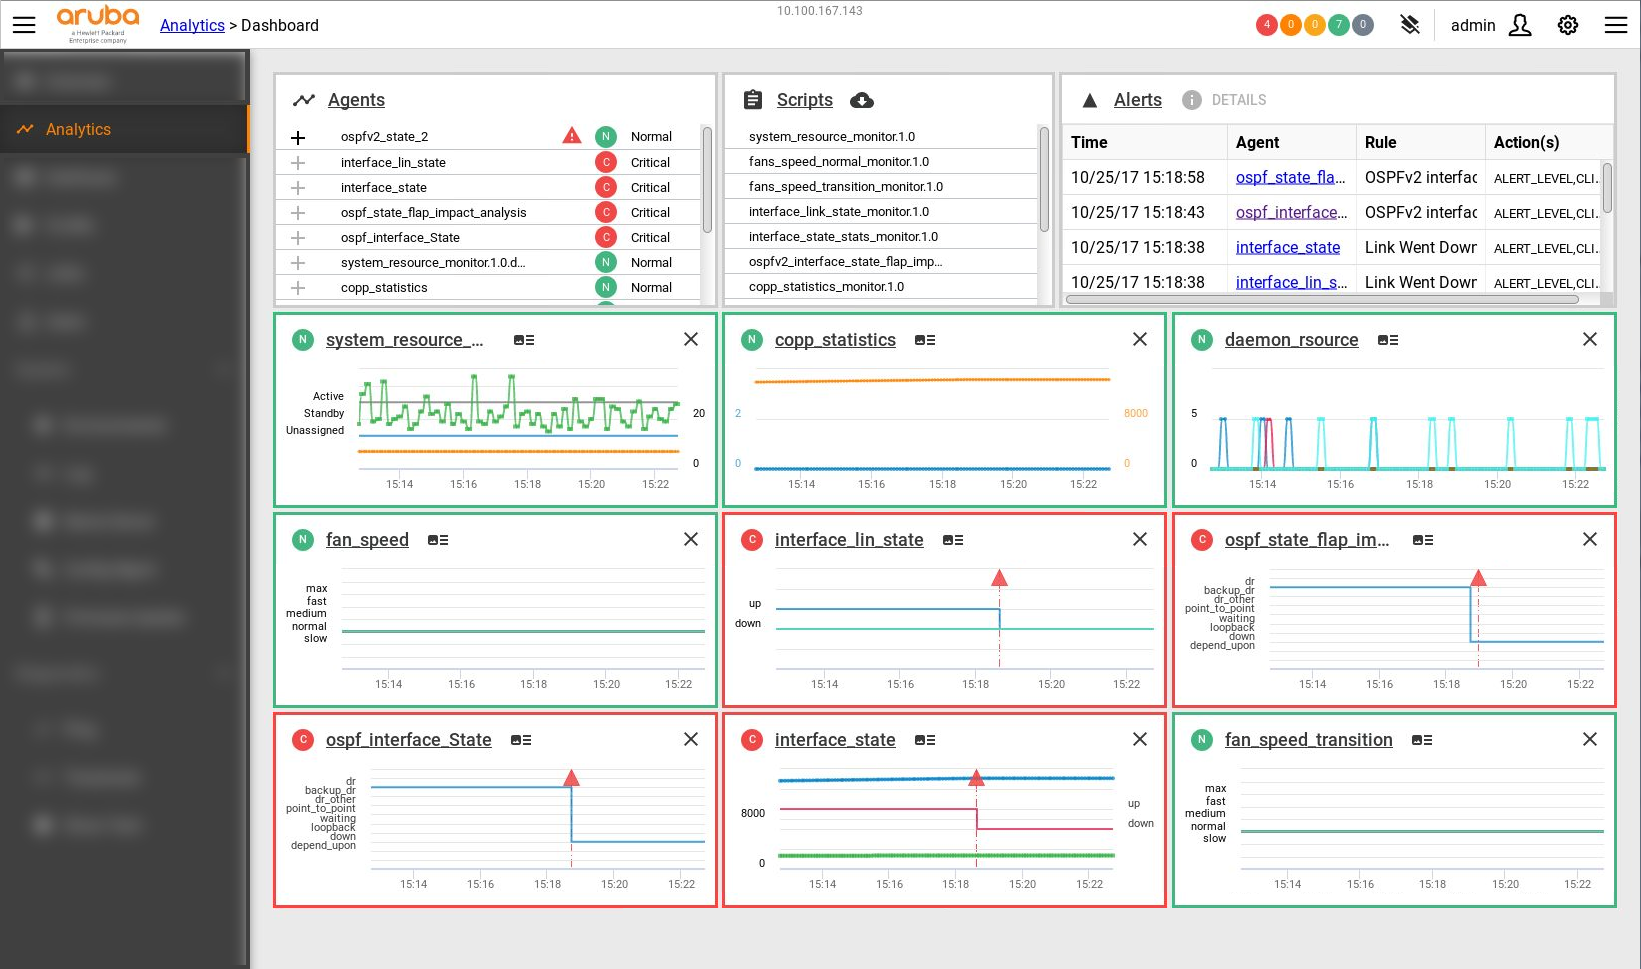 View the following information on the Analytics Dashboard:
Top banner: Shows the number of agents with each type of status.
Agents panel: Lists the agents installed on the switch and indicates the status of each agent.

If there is an error in an agent, the Agents panel shows an error icon next to the agent status.

Optionally, you can add an Analytics agent time series graph to the Analytics Dashboard by clicking the + plus sign next to any agent listed in the Agents panel.
The time series graph shows data collected by the Analytics agent. If an agent has multiple time series graphs, the graph displayed on the Analytics Dashboard is specified by the script. You cannot choose which graph to display on the Analytics Dashboard, but you can see all the graphs in the Agent Details page.
Click the Agents link to display the Agent Management page. On this page you can create, edit, delete, enable, and disable an agent.
Scripts panel: Lists available scripts.
Select a script from the list to display the Script Details page where you can view script details, create an agent to run the script, and download the script.
Click the Scripts link to display the Script Management page. On this page you can upload, download or delete a script, create an agent, and access the Aruba Solution Exchange to find more scripts.
Alerts panel: Lists alerts generated by all agents.
Select an alert in the list and click Details to display the Alert Details dialog box.
Click the Alerts link to display a list of the alerts with information on the rule and actions for each alert.
Time series graphs: If an agent time series graph has been added to the Analytics Dashboard, the graph is outlined in the agent status color. Agents can have more than one time series graph, but only one graph for the agent is displayed in the Analytics dashboard. Click the link in the graph to display the Agent Details page.
-
From the Analytics Dashboard, Agents panel, select the link to a specific agent. The Agent Details page is displayed.
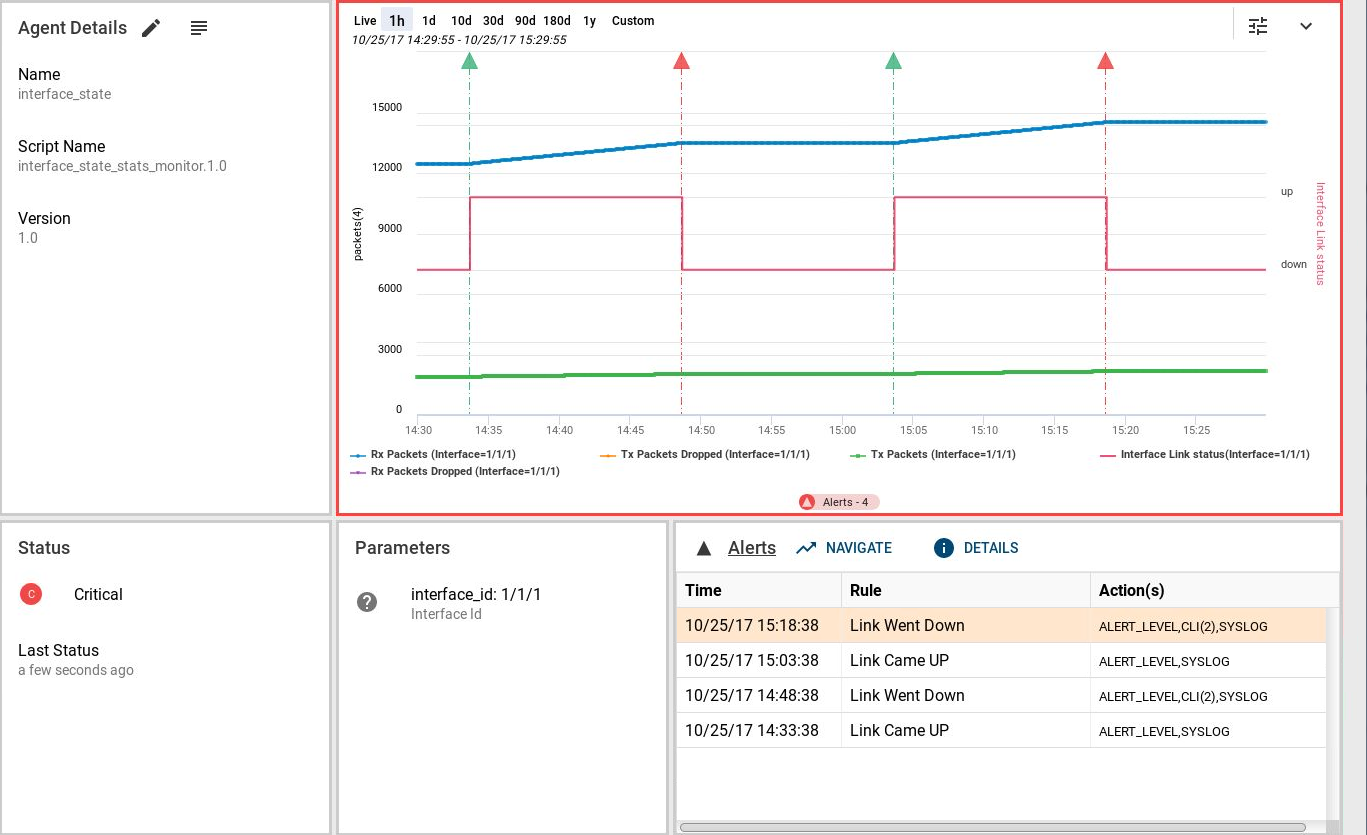 View the following information from the Agent Details page:
Agent Details panel: Shows information about the agent.
Select the
 Edit button to enable or disable an agent and modify agent parameters.
Select the
 View Script button to display the Script Details page where you can view script information, create an agent to run the script, and download the script.
Status panel: Shows the status of the agent and when the status was last updated. For some agents you may see additional information. For example:
- System Created
If the Status panel includes the statement
System Created, the agent cannot be deleted.- Baseline Thresholds
If the Status panel includes Baseline Thresholds, the agent has the ability to learn about the activity being measured and set low and high thresholds based on what it learns. The Baseline Thresholds information shown in the Status panel includes the number of thresholds in the following states:
- Active
When a baseline threshold is in the active state, the agent has learned and established the high and low thresholds, and the agent executes actions and generates alerts based on those low or high thresholds.
- Inactive
When agent is disabled, the baseline stops collecting data and updating thresholds. After the agent is re-enabled, the baseline goes into the learning state again.
- Learning
While a baseline threshold is in the learning state:
The agent gathers data related to that baseline until the initial learning period completes. Low and high thresholds are determined using the learning algorithm defined in the script, and are set only after learning state is completed.
Default thresholds (if specified in the script) are used to determine whether to execute actions or generate alerts.
Baseline thresholds remain in the learning state for a script-specified period of time after the agent is enabled.
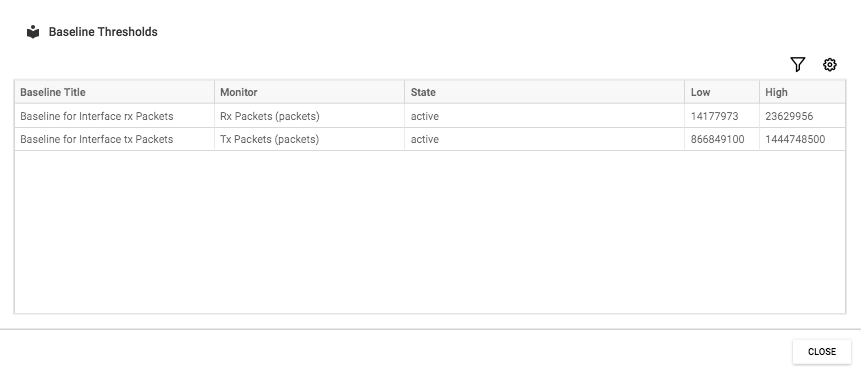
Selecting Baseline Thresholds displays a dialog box that shows additional information about all the baselines for the agent, including the name, the associated monitor, state, and the current learned low and high thresholds.
If there is an agent error, an error indicator is shown and you can hover over it for more information.
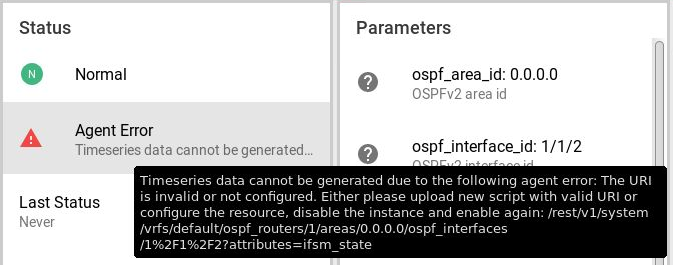
Parameters panel: Shows the parameters used by the agent. For example, a parameter can be a threshold value that, when breached, causes the agent status to change and an alert to be generated. Selecting a parameter displays the description in a dialog box.
Time Series graph: Graphs the data collected by the agent over time. Agents might have more than one time series graph. Alert indicators and configuration checkpoints are overlaid on the graph.
Alert indicators can include: a red or yellow triangle for an alert, a green triangle for return to normal, a blue triangle for an alert on several resources being monitored. An example of an alert on several resources: when monitoring multiple interfaces (wildcard), if an interface goes down, a red alert is generated. If another interface goes down, then a blue alert is generated. A green alert will not be generated until all the interfaces are back up.
Configuration checkpoints are shown as purple diamonds on the graph.
Clicking an alert indicator on the graph displays the Alert Details dialog box.
Alerts panel: Lists alerts.
Select the Alerts link to display a list of the alerts with information on the rule and actions for each alert.
Select an alert and click Details to display the Alert Details dialog box.
Select an alert and click Navigate to change the time series graph to show the time period with this alert.