Finding alert details using the Web UI
You can view details on the alerts displayed in the Web UI.
Prerequisites
You must be logged in to the ArubaOS-CX Web UI.
Procedure
-
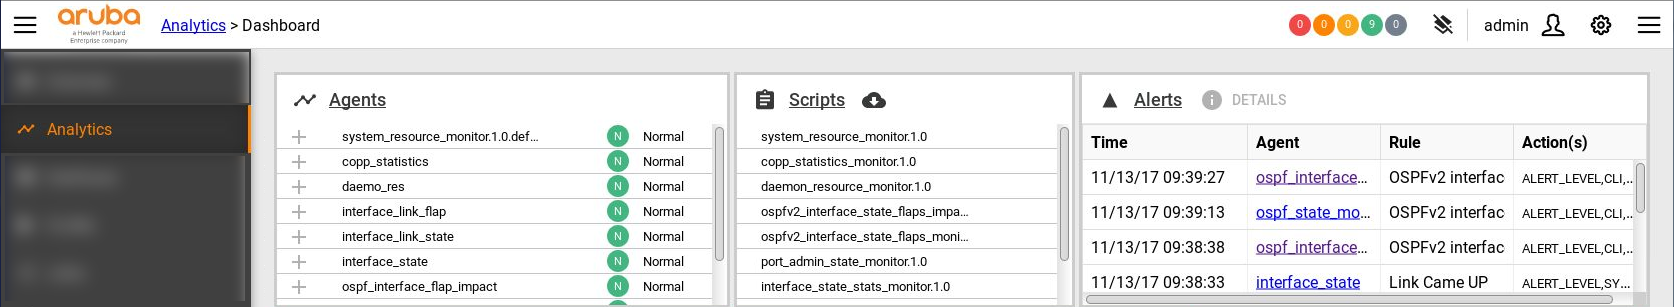
In the Analytics Dashboard, the Alerts panel lists the alerts for all agents.
-
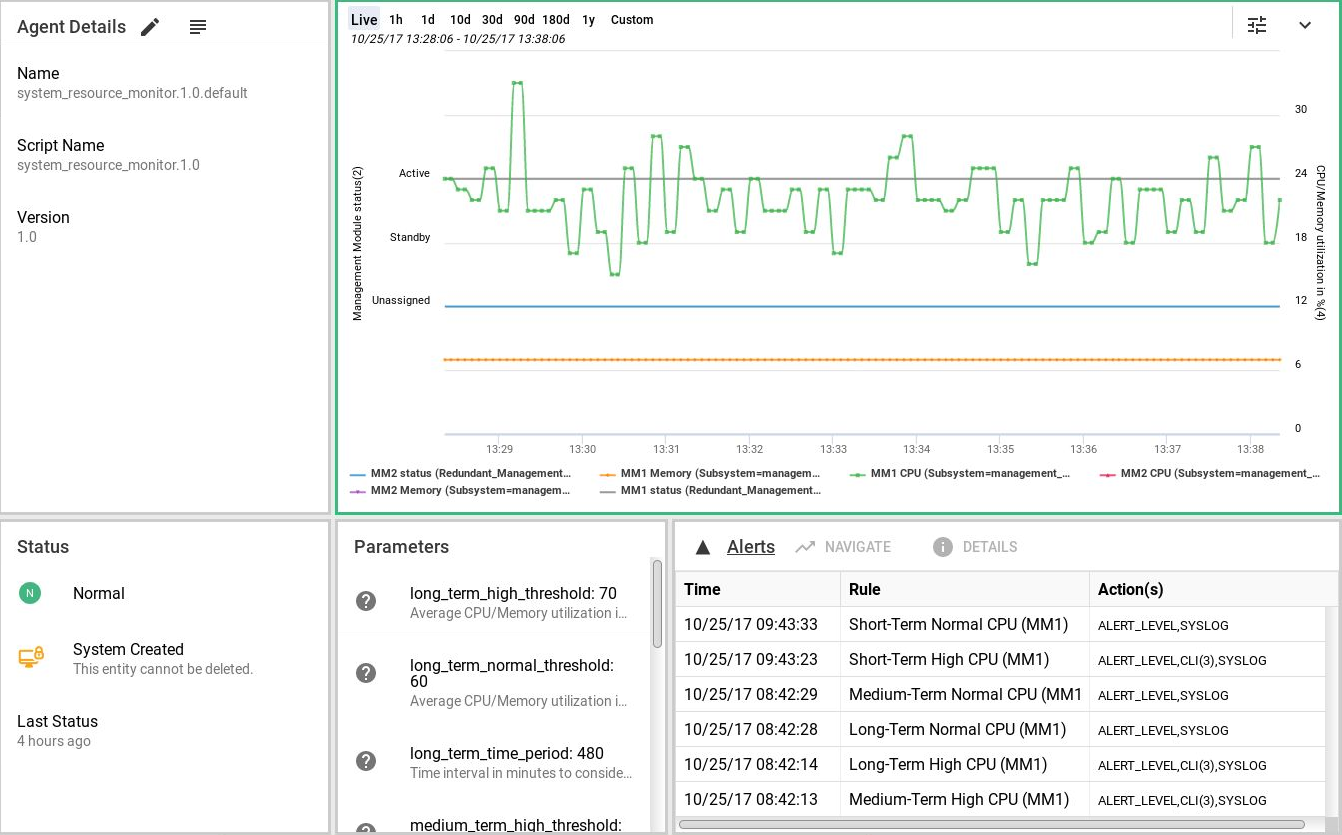
In the Agents Details page, the agent alerts are listed in the Alerts panel.
-
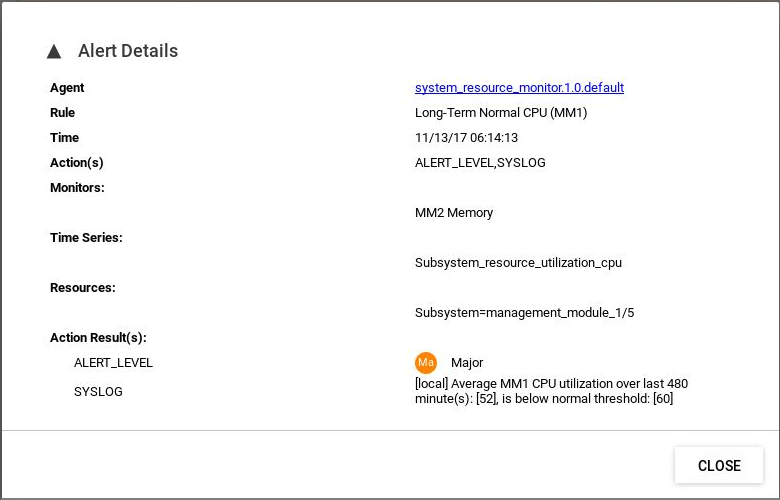
In the Alerts panel, select an alert and click
Details to view the Alert Details dialog box. Click
Close to close the dialog box.
You can also access alert details directly from the Analytics Dashboard by selecting an alert in the Alerts panel and clicking Details.
-
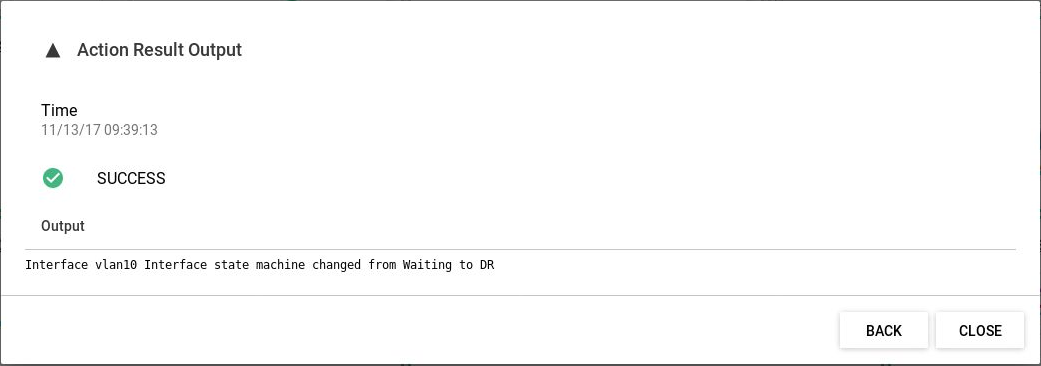
The
Action Result(s) in Alert Details dialog box might include additional details about actions and links to the action result output.
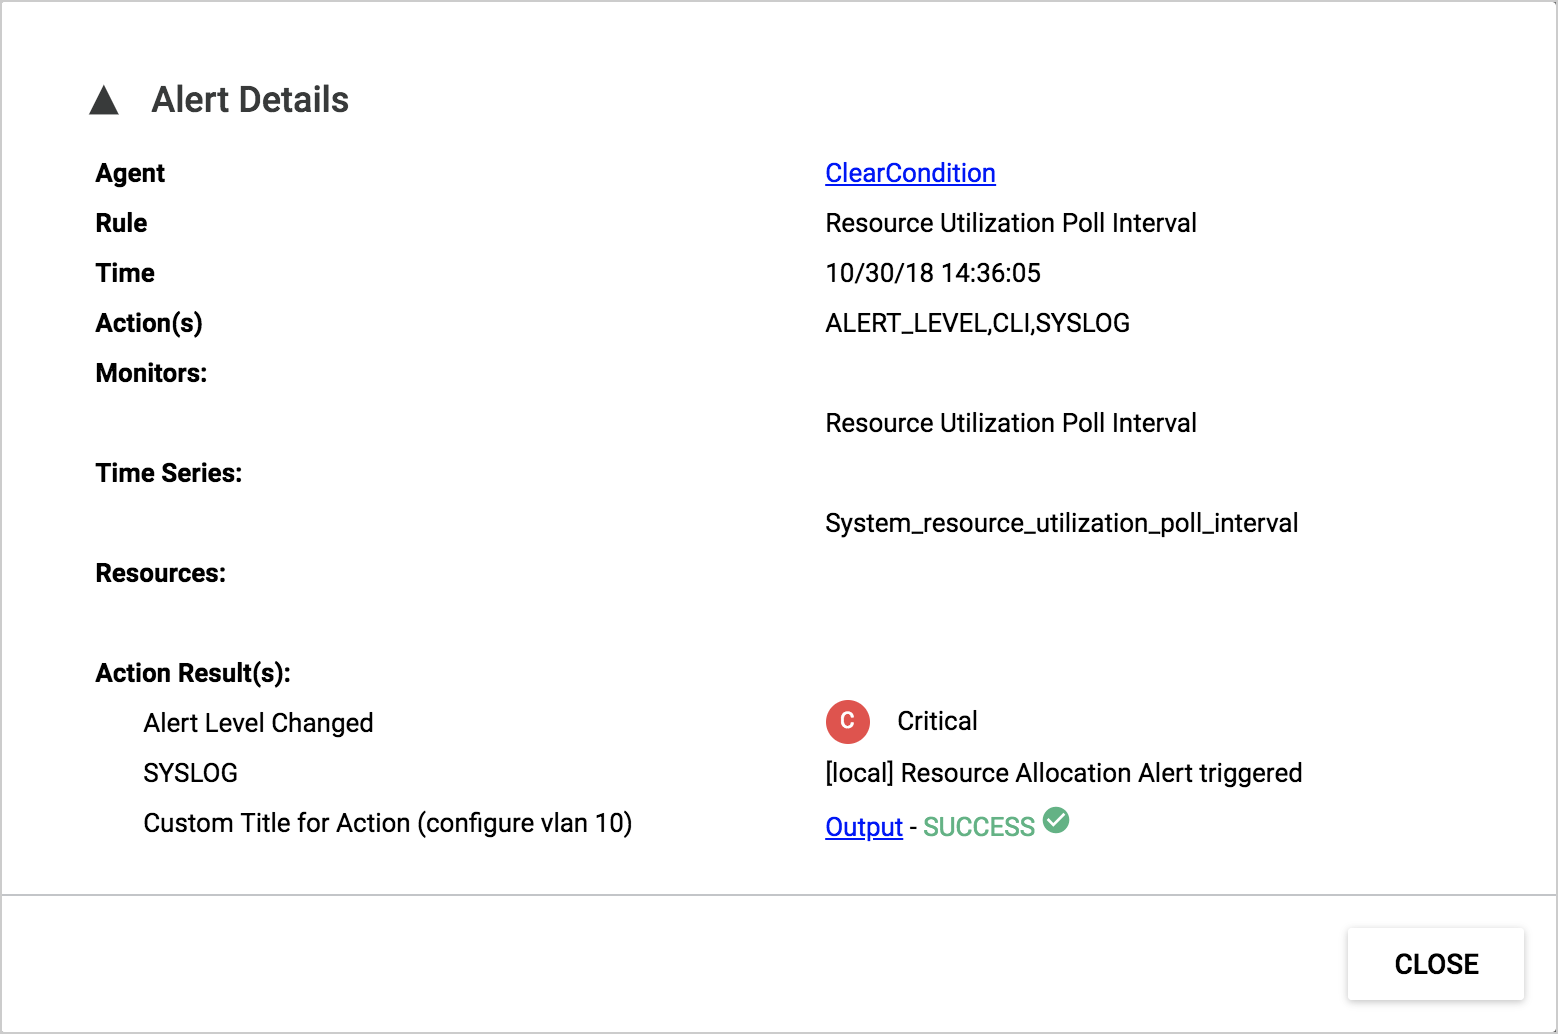
Click the Output link to view the Action Result Output dialog box.