ArubaOS-CX Web UI for Analytics introduction
The ArubaOS-CX Web UI provides access to information related to Aruba Network Analytics Engine agents, scripts, and alerts on the switch, including time-series data graphs and other information generated by the enabled agents.
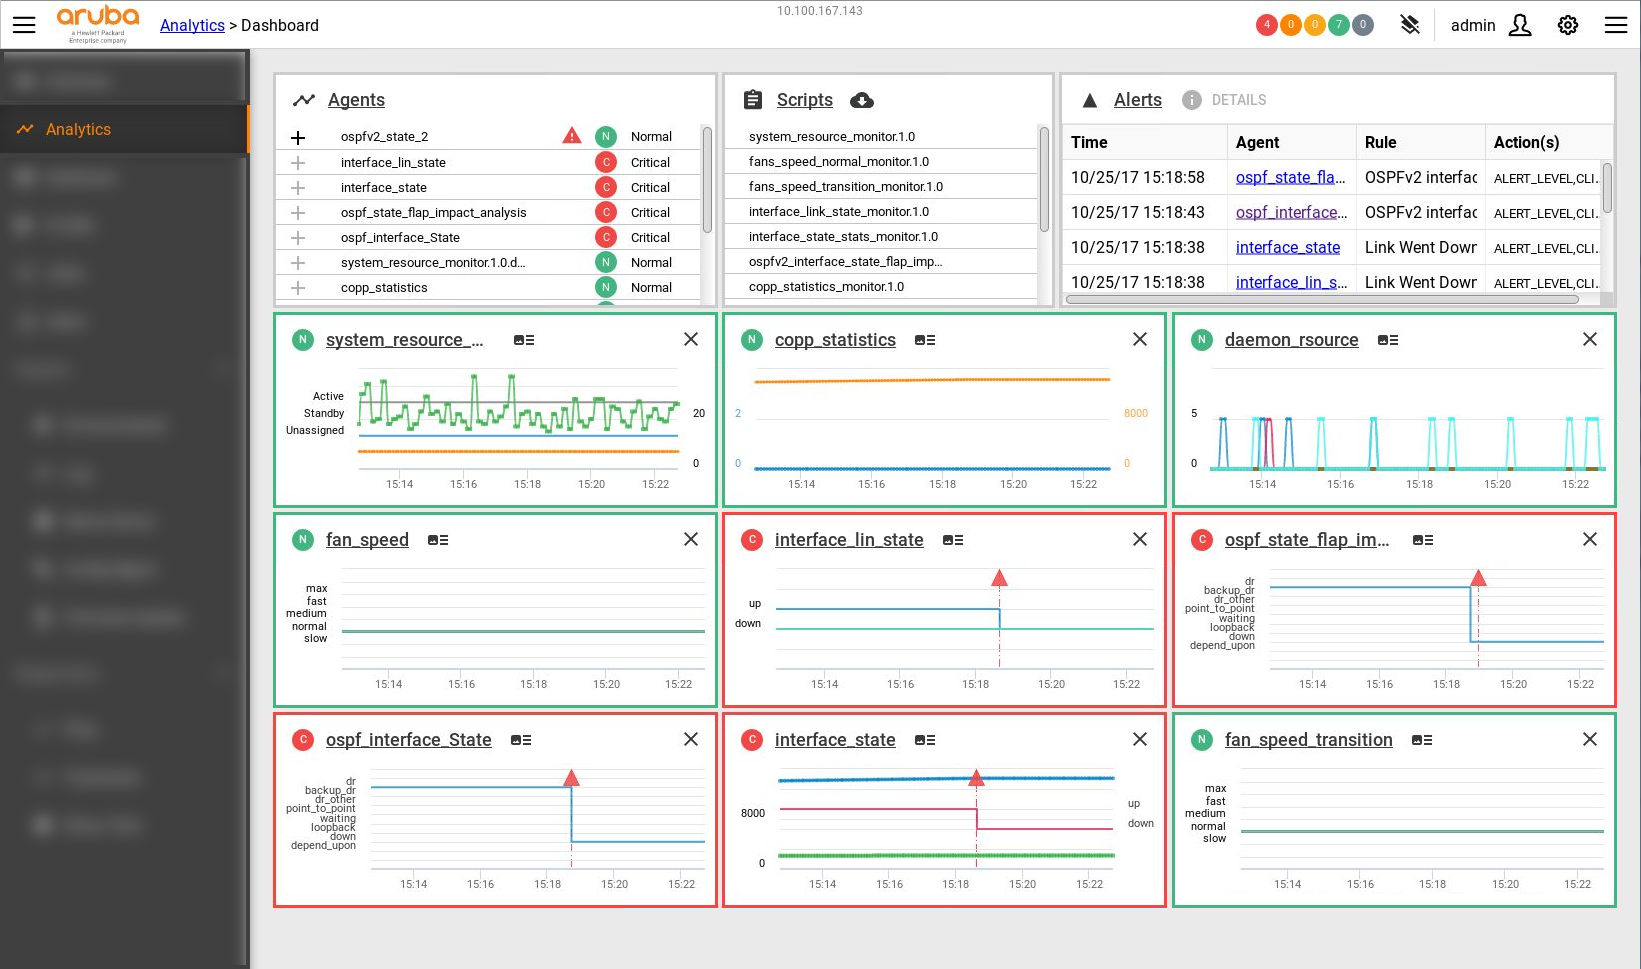
From the ArubaOS-CX Web UI, select Analytics in the navigation pane to view information in the Analytics Dashboard. You can display time-series graph panels for up to nine agents on the dashboard. However, many more agents can be enabled on a switch.
From the Analytics Dashboard, you can open Analytics detail pages. Analytics detail pages allow you to enable, disable, create, delete, or edit agents, upload scripts, and view detailed data about monitored resources. Administrator rights are required for actions that modify an agent.
For more information about the Web UI, see the introduction to the Web UI guide for your switch.