ArubaOS-CX Web UI framework
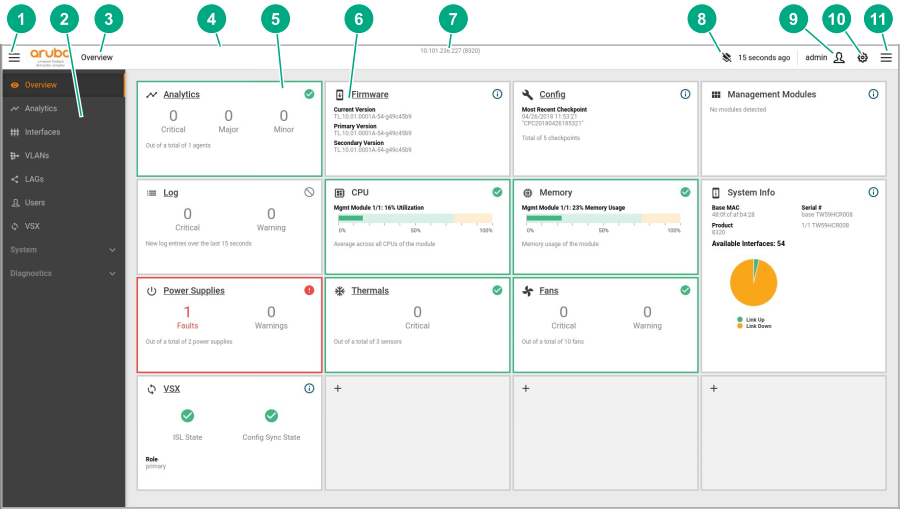
Descriptions for (numbered) common areas, buttons, menus, and controls in the Web UI are listed after the image.
-
The
 Show/Hide button on the left in the top banner, allows you to hide the navigation pane (slides the pane in and out).
-
The navigation pane. Expand or collapse the System or Diagnostics group to show or hide related items. For a description of each menu item in the navigation pane, see the description of the Navigation pane.
-
Breadcrumbs in the top banner show the path to your navigation selection.
-
The top banner provides information and other menu items.
-
The details pane shows information based on your selection.
-
Panels in the details pane display status, alerts, and other information and allow you to drill down to more information.
-
The IP address of the switch is displayed in the center of the top banner.
-
The
 Layout Management menu in the top banner allows you to unlock the details pane page layout. You can then resize and move panels, or reset the details pane page layout to the default layout. Changes are persistent in the local browser.
-
The
 User Management menu in the top banner includes a logout selection.
-
The
 System menu in the top banner includes the following:
-
Save Config: Save configuration changes
-
Reboot: Reboot the switch to either primary or secondary image.
-
API: Access REST APIs that you can use to read and/or write to the switch.
-
-
The
Show/Hide button on the right side of the top banner displays the Log Summary pane (slides the pane in and out). The Log Summary provides a summary of the most recent critical level log entries in the last X seconds. It also shows counts of the number of critical, warning, and info log entries arriving in the last X seconds.