Overview page
The Overview page provides a quick view of the status of a switch. It shows easy-to-read indicators for: Analytics agents, power supply, thermal, fans, CPU use, memory use, log entries, checkpoints, firmware, management modules, and system information.
Custom indicator panels allow you to select specific interfaces to monitor and to add panels for those interfaces to the Overview page.
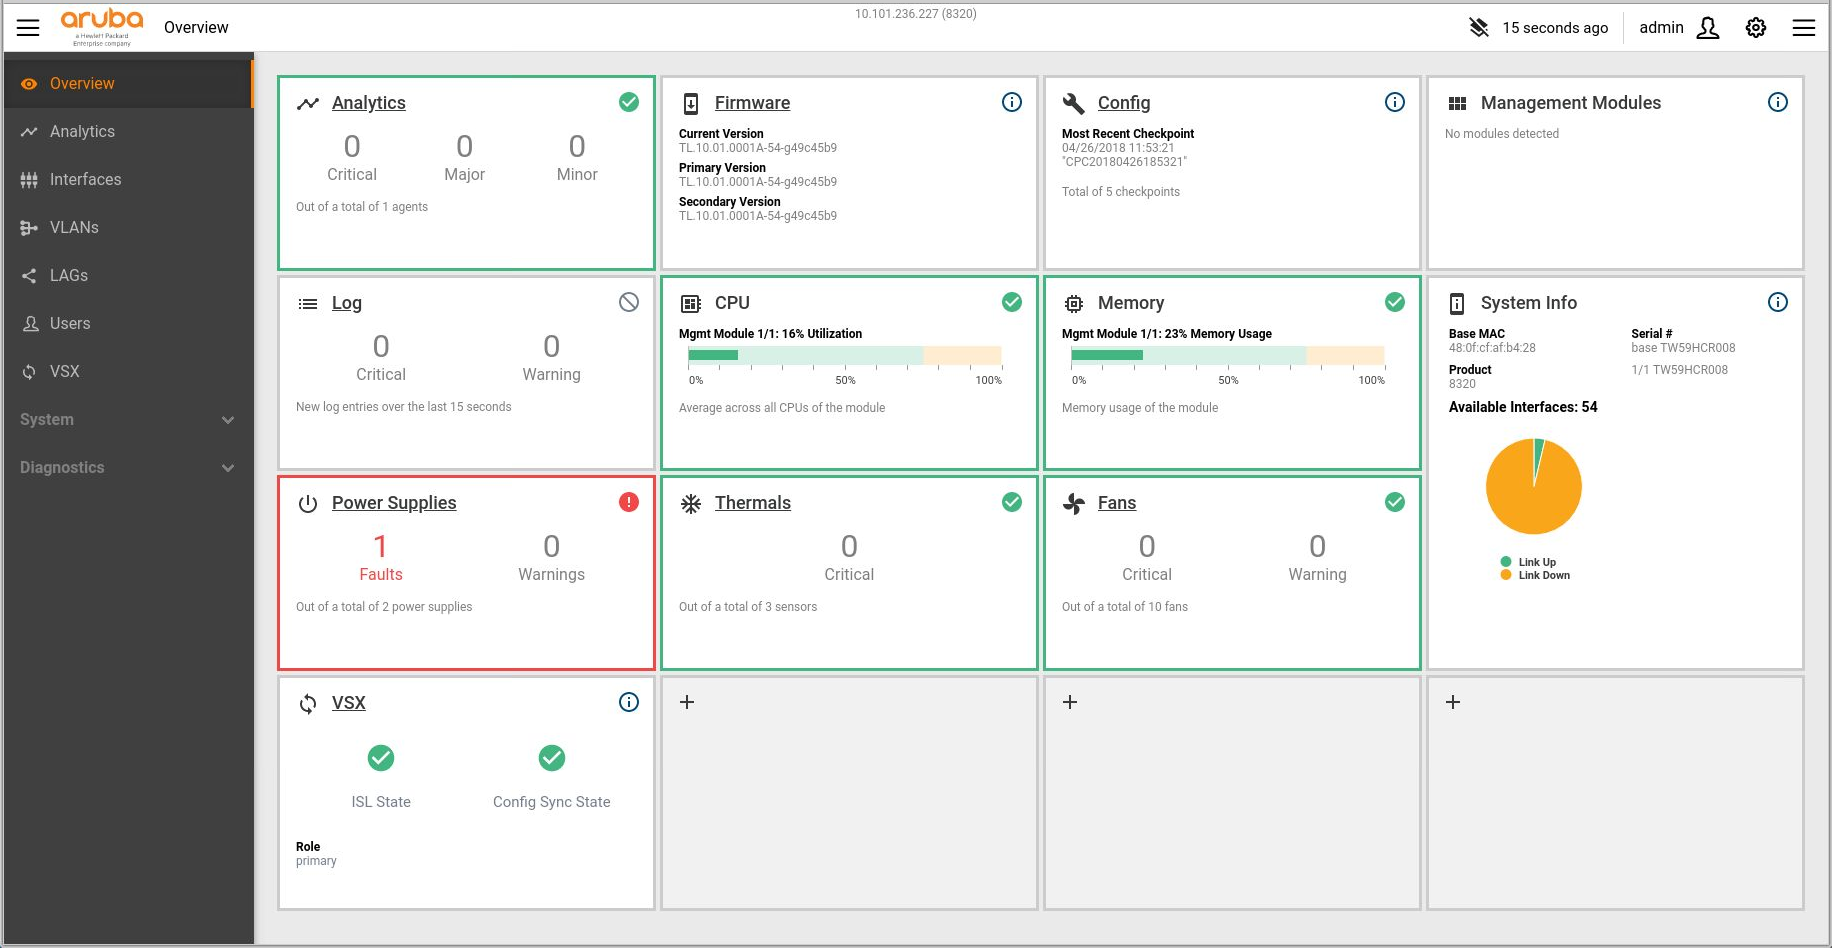
The following table describes each panel included out of the box in the Overview page.
| Panel | Description |
|---|---|
| Analytics | Shows: Total number of agents in critical, major, or minor status. Clicking the link displays the Analytics Dashboard. |
| Firmware | Shows: Current firmware version, Primary version, and Secondary version. Clicking the link displays the Firmware Update page. |
| Config | Shows: Most recent checkpoint and total number of checkpoints. Clicking the link displays the Config Mgmt page. |
| Management Modules | Shows: Detected module name, Active, and Standby status information. |
| Log | Shows: New log entries over the last 15 seconds. Clicking the link displays the Log page. |
| CPU | Shows: Current average CPU utilization per management module. |
| Memory | Shows: Percent memory usage per management module. |
| System Information | Shows: Uptime, Serial number, Base MAC, Total number of interfaces, and a pie chart for link status. |
| Power Supplies | Shows: Summary count of alerts. Clicking the link displays the Environmental page. |
| Thermal | Shows: Summary count of alerts. Clicking the link displays the Environmental page. |
| Fans | Shows: Summary count of alerts. Clicking the link displays the Environmental page. |
| VSX | Shows: Aruba Virtual Switching Extension (VSX) information, including interswitch link (ISL) state, configuration synchronization state, and the role of this switch (primary or secondary). Clicking the link displays the VSX page. |