Overview
The Next-Gen UI includes four major elements that are common across all views within the UI. The dashboard view, which provides an at-a-glance overview of system performance, is displayed here as an example. All four elements are described below the dashboard image.
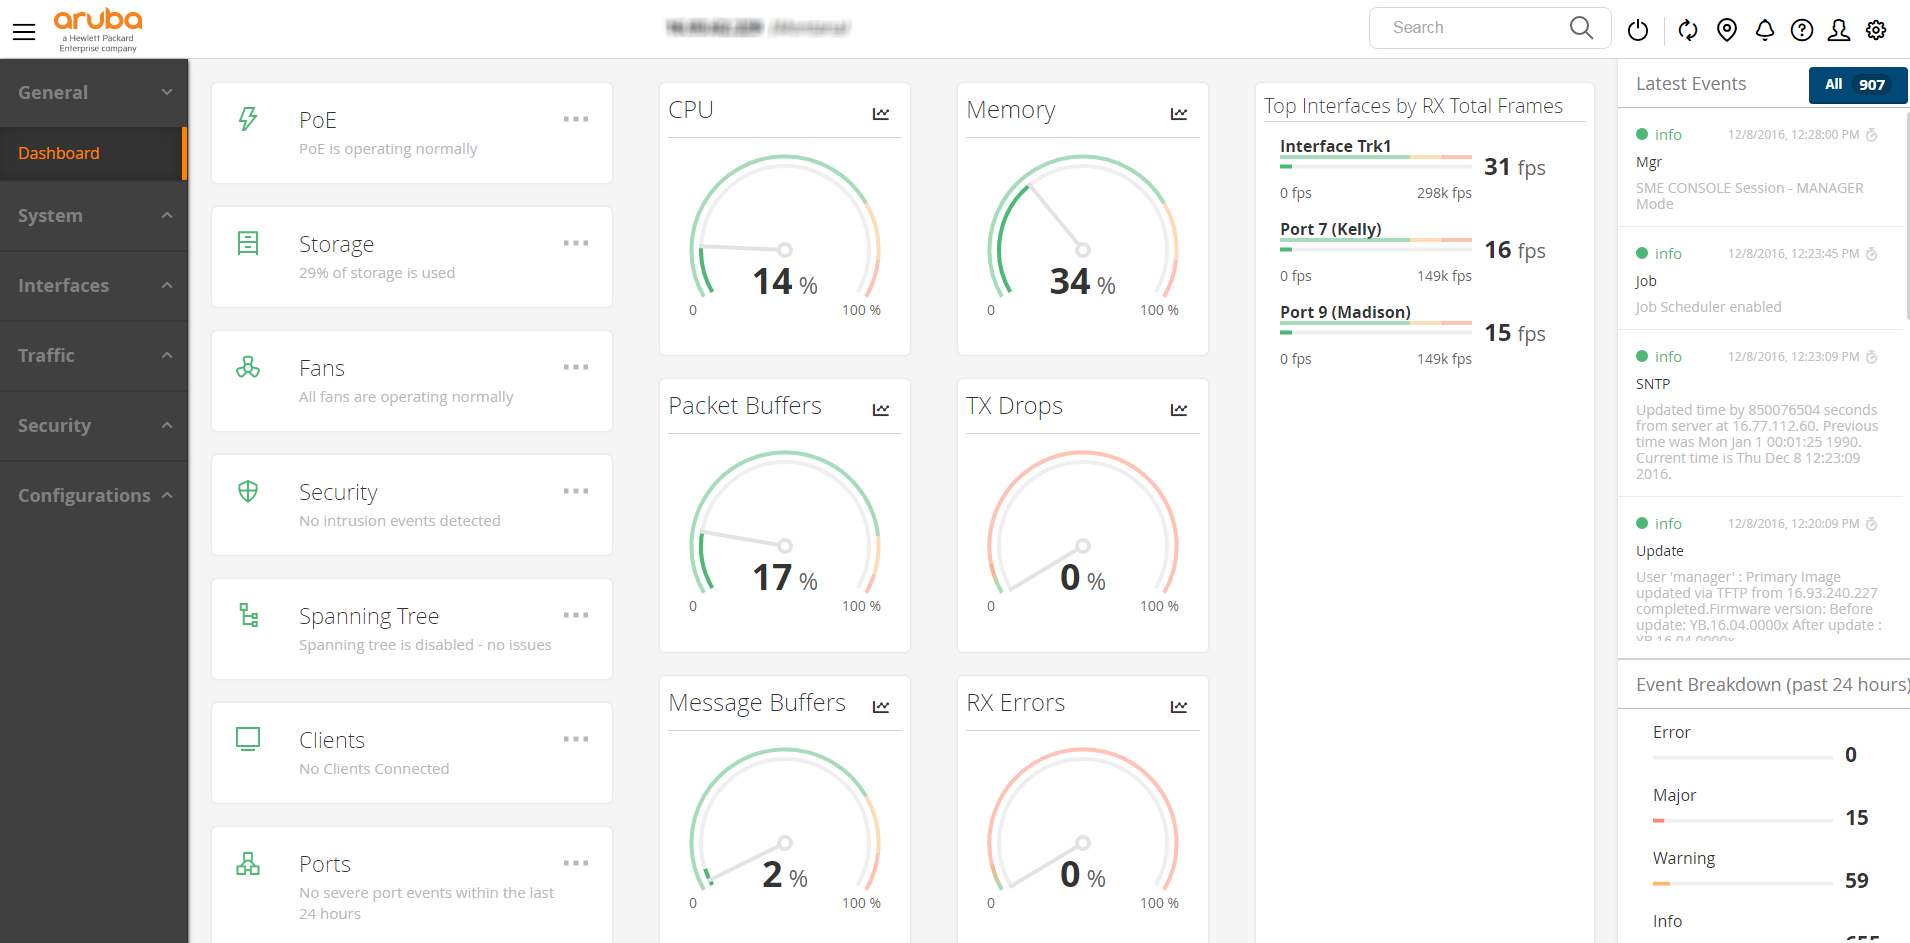
Header panel
This is the panel in the upper right corner of the screen. It includes the following icons and fields, from left to right:
Search: Enter a search term in this field and press Enter to view results.
Reboot: Click this icon to reboot the switch. You will be asked to confirm before the switch is rebooted.
Refresh: Click this icon to reload the components and refresh the page.
Toggle locator LED: Click this icon to identify a physical device.
Notifications: Click this icon to see a list of recent events.
Help: Click this icon to see the help text associated with the current screen.
User details: Click this icon to see a list of user roles. You can also launch the Traditional user interface by clicking Launch Traditional GUI.
Settings: Click this icon to modify the web interface settings for the current screen.
Navigation pane
This is the gray bar on the left side of the screen. It contains a series of drop-down menus, each representing an area of functionality, that allow you to navigate through the Improved UI. The drop-down menus include:
General: Includes the Dashboard submenu.
System: Includes the Status, Events, Monitor, SNMP, Firmware Update, and Stack (supported only for BPS/VSF) submenus.
Interfaces: Includes the Ports, PoE, Monitor, VLANs, and Trunks submenus.
Traffic: Includes the Spanning Tree submenu.
Security: Includes the Clients, User Roles, Intrusion Log, Port Security, and IP Authorization submenus.
Configurations: Includes the Config Report and Management submenus.
View pane
The view pane is a series of viewing options to the right of the navigation pane. It is broken into two sections:
Click on the ... icon in each status panel to navigate to the detailed view associated with the selected panel. For example, if you click on ... in th PoE view option, you will jump to the PoE page.
- PoE: Displays PoE port status.
Green: No PoE ports have a fault or have been denied power.
Yellow: One or more PoE ports have been denied power.
Red: One or more PoE ports have a fault.
- Storage: Displays system storage status.
Green: The current system storage use is within normal range.
Yellow: The current system storage use exceeds the warning threshold of 70%.
Red: The current system storage use exceeds the critical threshold of 90%.
- Fans: Displays system fan status.
Green: All fans are operating normally.
Yellow: One or more fans have failed but the number of failures does not exceed 50% of all system fans.
Red: At least 50% of the system fans have failed.
- Security: Displays security status based on the Intrusion Log flags.
Green: No intrusion events have occurred since acknowledgement.
Yellow: This status has no warning state.
Red: At least one new intrusion event has occurred.
- Spanning Tree: Displays spanning tree status.
Green: Spanning tree is disabled or no loop/root inconsistent ports were detected.
Yellow: Either loop or root inconsistent ports were detected.
Red: Both loop and root inconsistent ports were detected.
- Clients: Displays the summarized status of clients connected to the switch.
Green: All switch clients successfully authenticated/No Clients Connected.
Yellow: At least one client is not properly authenticated.
Red: Client authentication attempts were rejected.
- Ports: Displays ports with warning or critical events.
Green: Only info/debug events occurred on device ports.
Yellow: Warning events have occurred on one or more ports.
Red: Error/major events have occurred on one or more ports.
- Power Supplies: Displays system power supply status.
Green: All power supplies are operating normally.
Yellow: One or more power supplies have failed but the number of failures does not exceed 40% of all system power supplies.
Red: At least 40% of the system power supplies have failed.
- Temperatures: Displays system temperature status.
Green: The current system temperature is within normal range.
Yellow: The current system temperature exceeds the warning threshold of <variable>. The threshold is based on a user-controlled setting on the switch.
Red: The current system temperature exceeds the critical threshold of <variable>. The threshold is based on a user-controlled setting on the switch.
Uptime: Displays the device system uptime.
- CPU: Displays the current CPU usage of the device.
The outer ring of the gauge indicates regions of normal, warning, and critical values.
The peak value shown on the inner ring indicates the highest CPU usage reached for the device.
Green: CPU usage is within normal range.
Yellow: CPU usage exceeds the warning threshold of 75%.
Red: CPU usage exceeds the critical threshold of 90%.
- Memory: Displays the current memory usage of the device.
The outer ring of the gauge indicates regions of normal, warning, and critical values.
The peak value shown on the inner ring indicates the highest memory usage reached for the device.
Green: Memory usage is within normal range.
Yellow: Memory usage exceeds the warning threshold of 75%.
Red: Memory usage exceeds the critical threshold of 90%.
- Packet Buffers: Displays the current packet buffer usage of the device.
The outer ring of the gauge indicates regions of normal, warning, and critical values.
The peak value shown on the inner ring indicates the highest packet buffer usage reached for the device.
Green: Packet buffer usage is within normal range.
Yellow: Packet buffer usage exceeds the warning threshold of 85%.
Red: Packet buffer usage exceeds the critical threshold of 95%.
- Tx Drops: Displays the current transmit drop rate of the device.
The outer ring of the gauge indicates regions of normal, warning, and critical values.
The peak value shown on the inner ring indicates the highest transmit drop rate reached for the device.
Green: Transmit drop rate is within normal range.
Yellow: Transmit drop rate exceeds the warning threshold of 3% of transmit attempts.
Red: Transmit drop rate exceeds the critical threshold of 5% of transmit attempts.
- Message Buffers: Displays the current message buffer usage of the device.
The outer ring of the gauge indicates regions of normal, warning, and critical values.
The peak value shown on the inner ring indicates the highest message buffer usage reached for the device.
Green: Message buffer usage is within normal range.
Yellow: Message buffer usage exceeds the warning threshold of 75%.
Red: Message buffer usage exceeds the critical threshold of 90%.
- Rx Errors: Displays the current receive error rate of the device.
The outer ring of the gauge indicates regions of normal, warning, and critical values.
The peak value shown on the inner ring indicates the highest receive error rate reached for the device.
Green: Receive error rate is within normal range.
Yellow: Receive error rate exceeds the warning threshold of 2% of received frames.
Red: Receive error rate exceeds the critical threshold of 5% of received frames.
Top Interfaces: Displays the top ten ports with any one of 25 user-selected metrics (RX Total Frames in this example). Only ports that are enabled and up will be shown.
Right pane
Also called the events pane, this section displays:
The latest events on the system
User settings per page
User roles across the system
Help information