Interfaces — Monitor
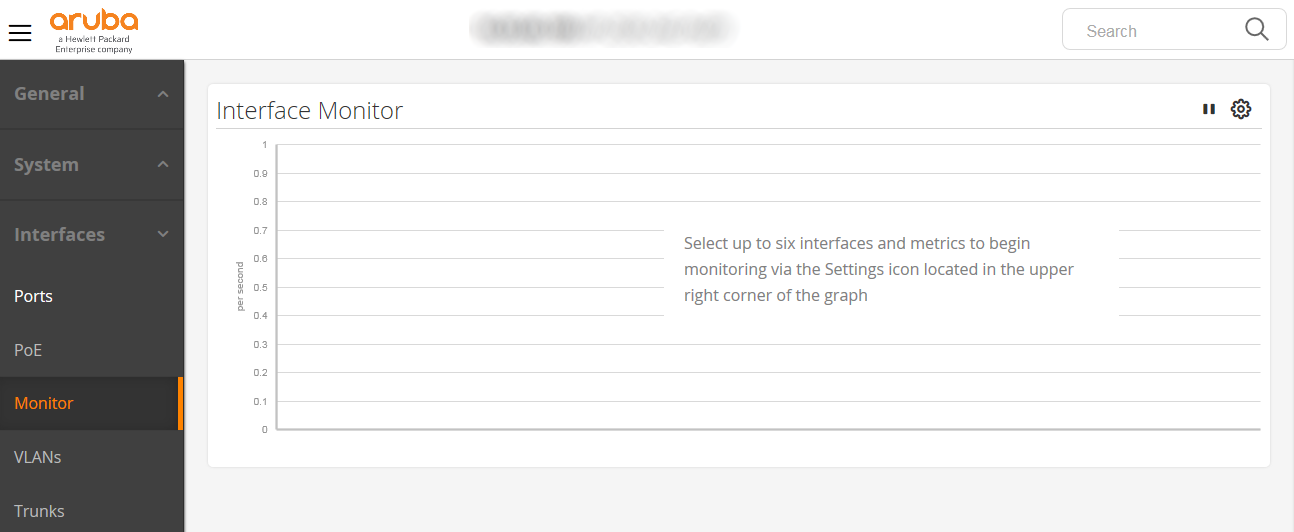
Interface Monitor Graph: Monitors up to six interface metrics at a given time.
There are approximately two dozen metrics to choose from on any interface; all except utilization are expressed as per-second rates (for example, frames/second).
Metrics may be monitored on a single interface or across multiple interfaces. The total number monitored at any juncture is limited to six or fewer.
Only interfaces that are enabled and up may be selected.
Metrics can be hidden from the graph by selecting the corresponding graph icon in the toolbar at the top of the graph.
Metric collection is started anew each time this view is entered.
Pause and Play Graph: Use the pause and play icons in the upper right corner of the graph to start and stop the display of data points on the graph.
Pausing the graph will not pause the collection of interface monitor data.
Upon restarting the graph, the data points collected while the graph was paused will be filled in.
Graph Options: Select the Graph Settings icon in the upper right corner of the graph to select interfaces and metrics to graph data for.