System — Stack
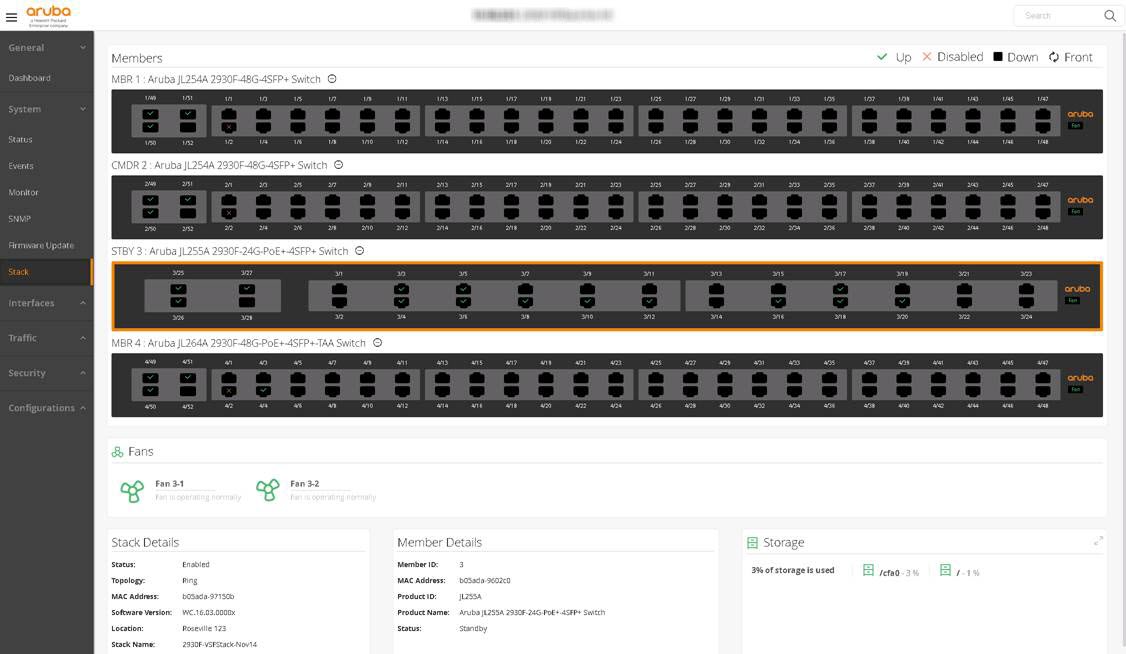
This view is only present on switch stacks.
Box Graphic: Displays each stack member physically.
Used to view member information.
The switch outlined in orange is the currently selected member.
Data on the page reflects the selected member.
The Box Graphic can be flipped to show either the front or back of the switch.
Fans: Displays member fan status.
Status:
Green: The current system storage use is within normal range.
Yellow: The current system storage use exceeds the warning threshold of 70%.
Red: The current system storage use exceeds the critical threshold of 90%.
Storage: Displays system storage status.
Status:
Green: All fans are operating normally.
Yellow: One or more fans have failed but the number of failures does not exceed 50% of all system fans.
Red: At least 50% of the system fans have failed.
Temperature: Displays system temperature status.
Status:
Green: The current system temperature is within normal range.
Yellow: The current system temperature exceeds the warning threshold of <variable>. The threshold is based on a user-controlled setting on the switch.
Red: The current system temperature exceeds the critical threshold of <variable>. The threshold is based on a user-controlled setting on the switch.
Power Supplies: Displays system power supply status.
Status:
Green: All power supplies are operating normally.
Yellow: One or more power supplies have failed but the number of failures does not exceed 40% of all system power supplies.
Red: At least 40% of the system power supplies have failed.
Stack Details: Displays system information regarding the stack including stack topology/configuration and software version on all members.
Member Details: Displays status, MAC address, location and stack name.
CPU: Displays the current CPU usage of the selected stack member.
The outer ring of the gauge indicates regions of normal, warning, and critical values.
The peak value shown on the inner ring indicates the highest CPU usage reached for the device.
Status:
Green: CPU usage is within normal range.
Yellow: CPU usage exceeds the warning threshold of 75%.
Red: CPU usage exceeds the critical threshold of 90%.
Memory: Displays current memory usage of the selected stack member.
The outer ring of the gauge indicates regions of normal, warning, and critical values.
The peak value shown on the inner ring indicates the highest memory usage reached for the device.
Status:
Green: Memory usage is within normal range.
Yellow: Memory usage exceeds the warning threshold of 75%.
Red: Memory usage exceeds the critical threshold of 90%.
Packet Buffers: Displays current packet buffer usage.
The outer ring of the gauge indicates regions of normal, warning, and critical values.
The peak value shown on the inner ring indicates the highest packet buffer usage reached for the device.
Status:
Green: Packet buffer usage is within normal range.
Yellow: Packet buffer usage exceeds the warning threshold of 85%.
Red: Packet buffer usage exceeds the critical threshold of 95%.
Tx Drops: Displays current transmit drop rate.
The outer ring of the gauge indicates regions of normal, warning, and critical values.
The peak value shown on the inner ring indicates the highest transmit drop rate reached for the device.
Status:
Green: Transmit drop rate is within normal range.
Yellow: Transmit drop rate exceeds the warning threshold of 3% of transmit attempts.
Red: Transmit drop rate exceeds the critical threshold of 5% of transmit attempts.
Message Buffers: Displays current message buffer usage.
The outer ring of the gauge indicates regions of normal, warning, and critical values.
The peak value shown on the inner ring indicates the highest message buffer usage reached for the device.
Status:
Green: Message buffer usage is within normal range.
Yellow: Message buffer usage exceeds the warning threshold of 75%.
Red: Message buffer usage exceeds the critical threshold of 90%.
Rx Errors: Displays the current receive error rate.
The outer ring of the gauge indicates regions of normal, warning, and critical values.
The peak value shown on the inner ring indicates the highest receive error rate reached for the device.
Status:
Green: Receive error rate is within normal range.
Yellow: Receive error rate exceeds the warning threshold of 2% of received frames.
Red: Receive error rate exceeds the critical threshold of 5% of received frames.